Guest Experience · 11 min read
Guest Journey Mapping for Hotels: A One Page Resort Template
Guest journey mapping for hotels on one page: seven resort phases, six rows, one guest type, filled in by department heads from evidence in ninety minutes.
On this page
- 01What is a guest journey map?
- 02What are the seven phases of a resort stay?
- 03What goes in each row of the template?
- 04Which phases carry the most weight?
- 05How do you fill it in with your team in ninety minutes?
- 06How do you read the finished map?
- 07How do you turn the map into changes?
- 08Where ResortConcierge helps
Key takeaways
- A resort guest journey map is one page: seven phases across, six rows down, one guest type per page.
- Rows one to four come from evidence (messages, reviews, requests); only row five, what we could do, is opinion.
- In-stay problems move satisfaction 217 points (J.D. Power 2025) and a third of reviews go unanswered (Shiji 2026), which is where the map usually points first.
- Read the map by finding the column with the lowest feeling and the worst metric, make one change per phase per quarter, and re-map in six months.
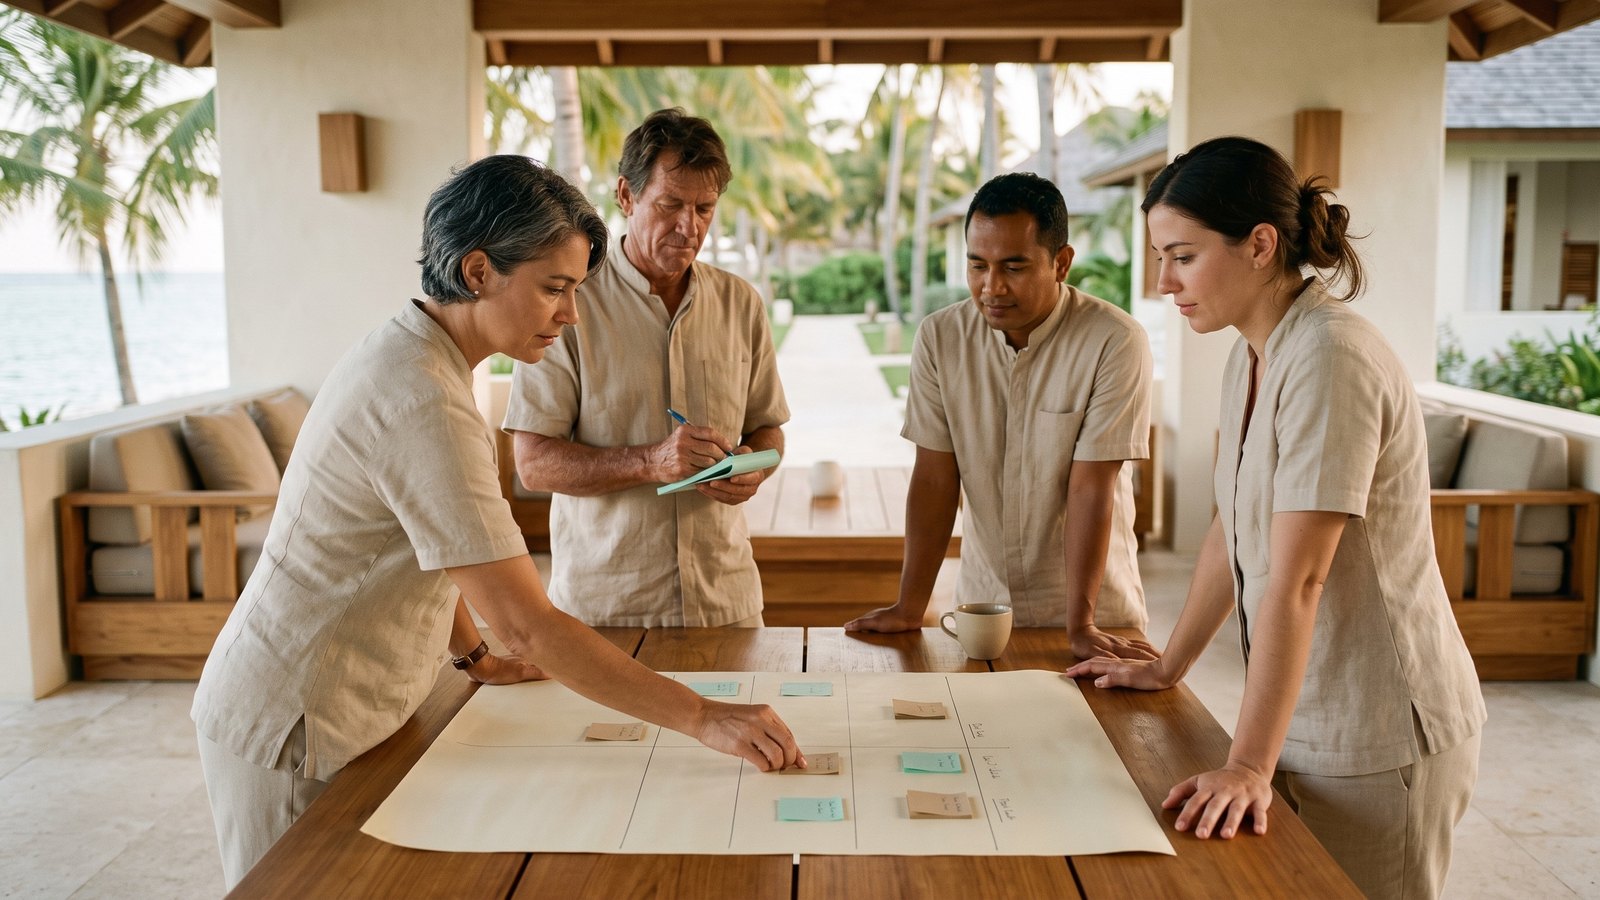
A guest journey map is a one page picture of what a guest does, asks and feels at each phase of a stay, next to what the property does about it. For a resort, the useful version has seven phases across the top, six rows down, one guest type per page, and takes a department-head meeting of ninety minutes to fill in from evidence rather than memory. Its payoff is a single sentence at the end of the meeting: this is the phase we fix first. The messaging tools in our guide to hotel guest communication software supply much of the evidence, but the map itself is paper, sticky notes and the people who run the departments.
Journey maps have a reputation for taking a consultant three months and forty columns, then getting laminated and ignored. I have lived a family of four's actual week at a resort, from the inside, more than once, and it fits on a page. The second version is the one that changes anything.
What is a guest journey map?
The Nielsen Norman Group, which wrote the standard reference in 2018 and reviewed it again in 2026, defines a journey map as a visualization of the process that a person goes through in order to accomplish a goal, with five components: an actor, a scenario and expectations, journey phases, actions, mindsets and emotions, and opportunities [1]. That is a methodology source, not a statistic, and it was written for software teams. Adapting it to a resort takes one paragraph.
The actor is one guest type: a family of four on a week's stay is a different map from a couple on a three night break, so each gets its own page. The scenario is the stay and what the guest expects from it. The phases are the seven columns below. Actions, mindsets and emotions become three rows: what the guest is doing, what they are asking, how they feel. Opportunities become the fifth row, what we could do, sitting under a fourth row the software version never needed: what we do today. I add a sixth, the metric we already track for that phase, because a resort does not need another dashboard. It needs to connect the map to numbers the general manager already reads.
What are the seven phases of a resort stay?
Research and book, pre-arrival, arrival, first evening, in-stay, departure, post-stay. Most hotel versions use five and fold the first evening into the stay. At a resort, the first evening earns its own column.
Here is why. The first evening is when the family discovers the pool closes at six, asks where to eat, learns the kids' club needs a booking, and quietly decides whether the week is going to work. It is also when the questions peak. The decision pattern shows up in experience data: Arival's 2025 research across tours and attractions found roughly one in five tour bookers and 22% of attraction visitors bought on the day of the experience, with flexibility the top reason for waiting, cited by 41% [4]. That is tours broadly, not resorts specifically, but the behavior is familiar to anyone who has arrived somewhere with children and tried to plan tomorrow before bedtime. The resort that answers the first evening well has set up the week.
The pre-arrival column matters for the same reason from the other direction: every question answered before arrival is one fewer on the first evening. The pre-arrival message sequence that cuts day-one questions is, in map terms, an opportunity written in the pre-arrival column that pays off in the first evening column.
What goes in each row of the template?
Six rows, and the rule for filling them is the whole discipline. Rows one through four come from evidence. Row five is where opinion belongs. Row six is a number you already have.
What the guest is doing: the actions, from message logs and observation. What the guest is asking: the real questions, pulled from chat, calls and desk notes for that phase. How the guest feels: from message tone, review language and, for the in-stay phase, sentiment on real messages. What we do today: the honest current practice, including the gaps. What we could do: the opportunity, one or two per phase, written as a change with an owner. Metric we already track: pre-arrival questions per arrival, time to first response, problems per 100 stays, review response rate, repeat booking share.
| Phase | Doing | Asking | Feeling | We do today | We could do | Metric |
|---|---|---|---|---|---|---|
| Research and book | Comparing two resorts on a phone | "Is the kids' club included?" | Hopeful, overwhelmed | Website FAQ | Answer the top ten questions in chat before booking | Booking conversion |
| Pre-arrival | Packing, planning the first day | "What time can we check in?" | Excited, slightly anxious | Confirmation email | Five message sequence with arrival details | Day-one questions per arrival |
| Arrival | Tired, hungry, kids restless | "Where is the pool?" | Relieved to be here, impatient | Desk check-in | Pre-check-in by message, room ready alert | Time at the desk |
| First evening | Finding dinner, learning the layout | "Do we need to book the kids' club?" | Hopeful, overwhelmed again | Printed directory | Welcome message with tonight's three answers | Questions in first 4 hours |
| In-stay | Pool, excursions, meals | "The AC is still not cold" | Relaxed, or quietly annoyed | Desk handles what it hears | Sentiment flag on every message, owner and clock | Problems per 100 stays, recovery rate |
| Departure | Packing, worrying about the flight | "Can we stay until two?" | Reluctant, rushed | Decided at the desk | Late checkout offer the evening before | Late checkouts sold |
| Post-stay | Posting a review, unpacking | "Would we come back?" | Nostalgic, or still annoyed | Reply when someone has time | Reply within 48 hours, rebook offer | Review response rate and time |
Illustrative filled-in map for a hypothetical family of four on a seven night resort stay, 2026. Every cell is an example for the exercise, not data from any property.
The "feeling" row is where I would spend the most time, and where the personalization question lives. What a resort knows about a guest and how it uses it belongs in the "we could do" row only if it passes the test in personalization without the creep factor: the guest told you, they would expect this use, they can see it.
Which phases carry the most weight?
In-stay and post-stay, by the data; arrival and departure, by the wallet. The sources below cover different samples and should not be stitched together, but each one puts a weight on a column.
In-stay: in J.D. Power's 2025 North America study of 39,219 hotel guests, 12% experienced a problem during their stay, and when a problem occurred, overall satisfaction fell 217 points on a 1,000 point scale [2]. Nothing else on the map moves a number that far. Post-stay: Shiji's 2026 benchmark of more than 40 million reviews across 12,000 hotels found a management response rate of 68.8% and an average response time of 3.5 days in 2025 [3]. That is a vendor benchmark, and it says roughly a third of reviews go unanswered and the rest wait half a week. Arrival and departure: in the Oracle Hospitality and Skift survey of 5,266 travelers in 2022, 37% said they would pay more for early check-in or late checkout and 54% to choose their view [5]. Four years old now, directional, and a clear sign that those two columns hold revenue, not just friction.
The in-stay column is also the only one with a clock on it. A problem caught on night two can be fixed; a problem read in a review on Monday cannot. The 48 hour window for service recovery is the operational version of that column, and the map is how you decide whether your property is inside the window or outside it.
How do you fill it in with your team in ninety minutes?
Gather the evidence first, then run the meeting to a clock. The evidence to bring: two weeks of guest messages grouped by phase, the last quarter's review themes, the request log by category, and response times by hour. Without that, the meeting fills the map from memory, and memory remembers the loud guest, not the typical one.
| Time | Step | Rule |
|---|---|---|
| 0 to 10 min | Pick the actor | One guest type per page; agree the scenario and season |
| 10 to 35 min | Rows one to three from evidence | Doing, asking, feeling; no opinions, quote the messages |
| 35 to 50 min | Row four, honestly | What we do today, including what nobody does |
| 50 to 65 min | Row six | Which metric already measures each phase; write the current value |
| 65 to 85 min | Row five | Opportunities, one or two per phase, each with an owner |
| 85 to 90 min | Read the map | Lowest feeling plus worst metric is the first fix |
Ninety minute meeting agenda for a resort guest journey map. Practice agenda, 2026.
Three rules keep it honest. One actor per page; if someone says "but business guests," start a second page later. No opinion in rows one to four; if a department head says "guests love the welcome drink," ask for the message that says so. And every opportunity gets a name next to it before the meeting ends, or it is not an opportunity, it is a wish.
How do you read the finished map?
Find the column where the feeling row is lowest and the metric is worst. That is the first fix. Not the phase the general manager finds most interesting, not the one with the newest vendor pitch, the one where the guest is unhappiest and the number proves it.
Be careful with the feeling row, because silence is not satisfaction. Qualtrics XM Institute's 2025 consumer trends research across nearly 24,000 consumers found that direct feedback after a bad experience had fallen eight points since 2021 [6]. Fewer guests tell you when something goes wrong. Years of listening to people for a living taught me the same thing: the ones who have given up on you stop talking first. A column with no complaints and a bad metric is not a quiet success. It is a guest who has decided you cannot help.
Then one change per phase per quarter, no more. Re-map in six months with the same actor and compare. If a feeling went up and the metric moved, keep going. If neither moved, the opportunity was wrong, and the honest thing to do is write that in the next map's row four.
How do you turn the map into changes?
Each opportunity in row five gets an owner, a date and the metric from row six. That is the whole conversion from map to work. Three examples, one per phase type.
A pre-arrival opportunity: the five message sequence, owned by the front office manager, live by the first of next month, measured by day-one questions per arrival. An in-stay opportunity: a sentiment flag on every message with a named owner and a clock, owned by the duty manager, measured by problems per 100 stays and the share recovered before checkout. A departure opportunity: the late checkout offer sent the evening before, owned by the revenue lead with housekeeping's agreement, measured by late checkouts sold and rooms not ready at 3pm.
Notice that none of those is a software purchase. Some are helped by software; all of them are decisions. The map's job is to make the decision obvious and the owner visible, and a map that does that in ninety minutes has done more than most that took a quarter.
Where ResortConcierge helps
The general practice is evidence in rows one to three, judgment in row five, and a metric you already track in row six. ResortConcierge AI supplies the evidence rows from the unified inbox and analytics that show what guests actually ask in each phase, pre-arrival, first evening and departure, so the "asking" row is quotes rather than recollections.
Once the map says the pre-arrival or departure column is the weak spot, pre-arrival and departure messages by audience are how the opportunity gets built: the five message sequence, the late checkout offer, sent to the right guests at the chosen hour.
For the in-stay "feeling" row, sentiment scoring on real guest messages gives the meeting a read on tone from the conversations themselves rather than from the loudest story in the room. One honest limit: pulling arrival and departure times automatically into the journey depends on property management system (PMS) connectors, which are planned, not shipped, so today those come from the PMS report.
Print the template, pick one guest type, and book ninety minutes with your department heads before the season starts. Bring the messages. The map will tell you which column to fix first, and it will tell you in your guests' own words.
Frequently asked questions
Private founding offer
Five resorts. One founding rate.
We are opening the concierge to five founding resorts. You get a locked founding rate, a 90-day readout on guest requests and staff time, and you start without a card.
- Open to five resorts only
- Founding rate locked in
- 90-day readout
- No card to start
Sources and notes (6)
- 1.Journey Mapping 101 (opens in a new tab) Nielsen Norman Group (Sarah Gibbons), published 2018, reviewed July 2026, 2018
- 2.J.D. Power 2025 North America Hotel Guest Satisfaction Index Study (opens in a new tab) J.D. Power, via Business Wire, 2025
- 3.Guest Experience Benchmark Report 2026 (opens in a new tab) Shiji (ReviewPro), via Hospitality Net, 2026
- 4.Why Travelers Book Experiences in Advance (or Not) (opens in a new tab) Arival (Douglas Quinby), 2025
- 5.Hospitality in 2025: Automated, Intelligent... and More Personal (opens in a new tab) Oracle Hospitality and Skift, 2022
- 6.2025 Consumer Experience Trends (Qualtrics XM Institute), as reported by MarTech (opens in a new tab) MarTech, 2024

Written by
Brittany RoachWriter, guest experience
Brittany Roach writes about guest experience from both sides of the front desk: a career spent helping people through complicated moments, and a lot of time as a traveler with a family in tow.
Keep reading
Related articles
Pre-Arrival Communication for Hotels: Five Messages, Timed Right
Pre-arrival communication for hotels that cuts day-one questions: five messages timed to the booking window, the channel for each, and one offer, not five.
Hotel Personalization and Guest Data: Where Creepy Begins
Hotel personalization built on guest data guests gave you, used as they expect, with a way to see it, is welcome. The three question test and what to store.
Hotel Guest Communication Software, Explained for Operators
What hotel guest communication software is, the four parts that matter, how the pricing works, and which features a resort under 150 rooms can safely skip.