ResortConcierge AI Research · No. 05
The In-Stay Revenue Report
Where resort money comes from now, and how much of it reaches profit

On this page
- 01About this report
- 02Key findings: eight numbers on where in-stay money goes
- 03The growth is outside the room
- 04Revenue grew; profit mostly did not
- 05Guests buy time, and they buy it close to the day
- 06Direct guests book bigger, but no current public data shows what they spend on property
- 07After the fee rule, the total price is the price
- 08Keeping more of each in-stay dollar
- 09Test your own property: the two-hour ancillary scorecard
- 10What operators are saying
- 11How we built this report
- 12About ResortConcierge AI
- 13Sources
About this report
Room revenue barely grew in 2025. So where does a resort's next year of growth come from, and how much of it is left after paying the people who deliver it? That is the question behind The In-Stay Revenue Report, the fifth report in the ResortConcierge AI Research series. The short answer from the evidence: the growth is outside the room, but only offers that are timed, priced and staffed well reach profit.
It is written for general managers (GMs) and owners of independent resorts with 40 to 400 rooms, and for the revenue, rooms, food and beverage and spa leaders who design the offers and staff them.
This edition is built from published evidence: operating statement benchmarks, booking and upsell platform data, traveler surveys, federal regulation and trade reporting. Every figure was taken from a source page that was opened and read, and then checked again in a separate pass by a checker who had no hand in writing the report. Where a figure was read in a republication, the Sources list says so. Vendor data is labeled as vendor data, and anything older than four years carries its year. Where the evidence is thin, we say so. On the question owners ask most, whether direct guests spend more once they arrive, we say plainly that no current public answer exists.
Inside are eight numbers worth knowing, six chapters, a two-hour scorecard you can fill in from your own property management system (PMS) and point of sale (POS) reports, and the full method and source list. The designed report, with the printable scorecard, is free to download.
Key findings: eight numbers on where in-stay money goes
The evidence points two ways at once. Revenue outside the room is growing faster than room revenue, and resorts were one of only two hotel types to grow profit in 2025. But in 2024 labor took most of each extra dollar, and the add-ons guests buy are few and bought late.
56%
Share of revenue from rooms in CBRE's sample of 61 US resorts in 2024. Food and beverage (F&B) brought in 29%, other operated departments 10% and miscellaneous income 5%.
CBRE Hotels Research in LODGING, November/December 2025 (61 resorts averaging 280 rooms and a $439.85 average daily rate; luxury-skewed)
10.9%
Growth in miscellaneous income across 2,216 US hotels in 2025, against 1.1% for rooms. F&B grew 4.3% and other operated departments 7.8%.
CBRE Trends via LODGING, May 2026 (all hotel types, not resorts only)
$0.75
Labor's share of each extra dollar of US hotel revenue in 2024. Costs rose $1.04 for every $1 of new revenue.
HotStats benchmark (Duetto), 2024 (sample size not disclosed)
59%
Share of annual gross operating profit (GOP) that summer seasonal resorts earn in their peak months. Winter seasonal resorts earn 63% in theirs.
CBRE Hotels Research in LODGING, November/December 2025 (same 61 resorts)
Up 2.6% or down 8.8%
2025 revenue depends on whose sample you read. CBRE has total revenue up 2.6%; HotelData.com has total revenue per available room (TRevPAR) down 8.8%.
CBRE Trends via LODGING, May 2026; HotelData.com via LODGING, February 2026 (vendor, sample not stated)
90%
Share of upsell revenue from early check-in and late checkout. The most common price paid was $50.
Akia, August 2026 (4,729 paid upsells at about two dozen hotel and vacation rental operators; vendor)
1.59%
Share of stays that bought any upsell: 3.66% for guests who booked 31 to 60 days ahead, 0.89% for same-day arrivals.
Akia, August 2026 (same sample; vendor)
$516 vs $312
Average value of a booking on a hotel website against one through an online travel agency (OTA) in 2025. Per booking, not spend on property.
SiteMinder Hotel Booking Trends, 2026 (over 140 million reservations in 20 destinations; vendor)
None of these figures comes from independent resorts with 40 to 400 rooms alone; that data does not yet exist in public. The resort benchmark leans luxury and the 2025 growth rates cover every hotel type. The main upsell dataset pools hotels with vacation rentals. Read them as the clearest available view, then put your own numbers beside them with the scorecard at the end.
The full report
The In-Stay Revenue Report
The growth is outside the room
Rooms still bring in most of a resort's revenue, but they are no longer where revenue grows. In 2025, room revenue rose 1.1% across 2,216 US hotels while every other department grew faster (CBRE). Resorts were one of only two hotel types to grow profit.
The mix. The clearest public view of a resort's revenue comes from CBRE Hotels Research, which analyzed the monthly operating statements of 61 US resorts for 2024. Rooms brought in 56% of revenue, F&B 29%, other operated departments 10%, and miscellaneous income 5% (CBRE in LODGING, November/December 2025). In CBRE's own examples from its 2025 Trends survey, other operated departments are lines such as parking, retail, spa and golf (CBRE Trends via LODGING, May 2026).
That sample is not a typical independent. The resorts averaged 280 rooms, 61.1% occupancy and an average daily rate (ADR) of $439.85, and CBRE says "this dataset favors luxury properties and does not represent the entirety of the U.S. resort market." Read the shares as the shape of a large, high-rate resort, not a target for a 90-room property.
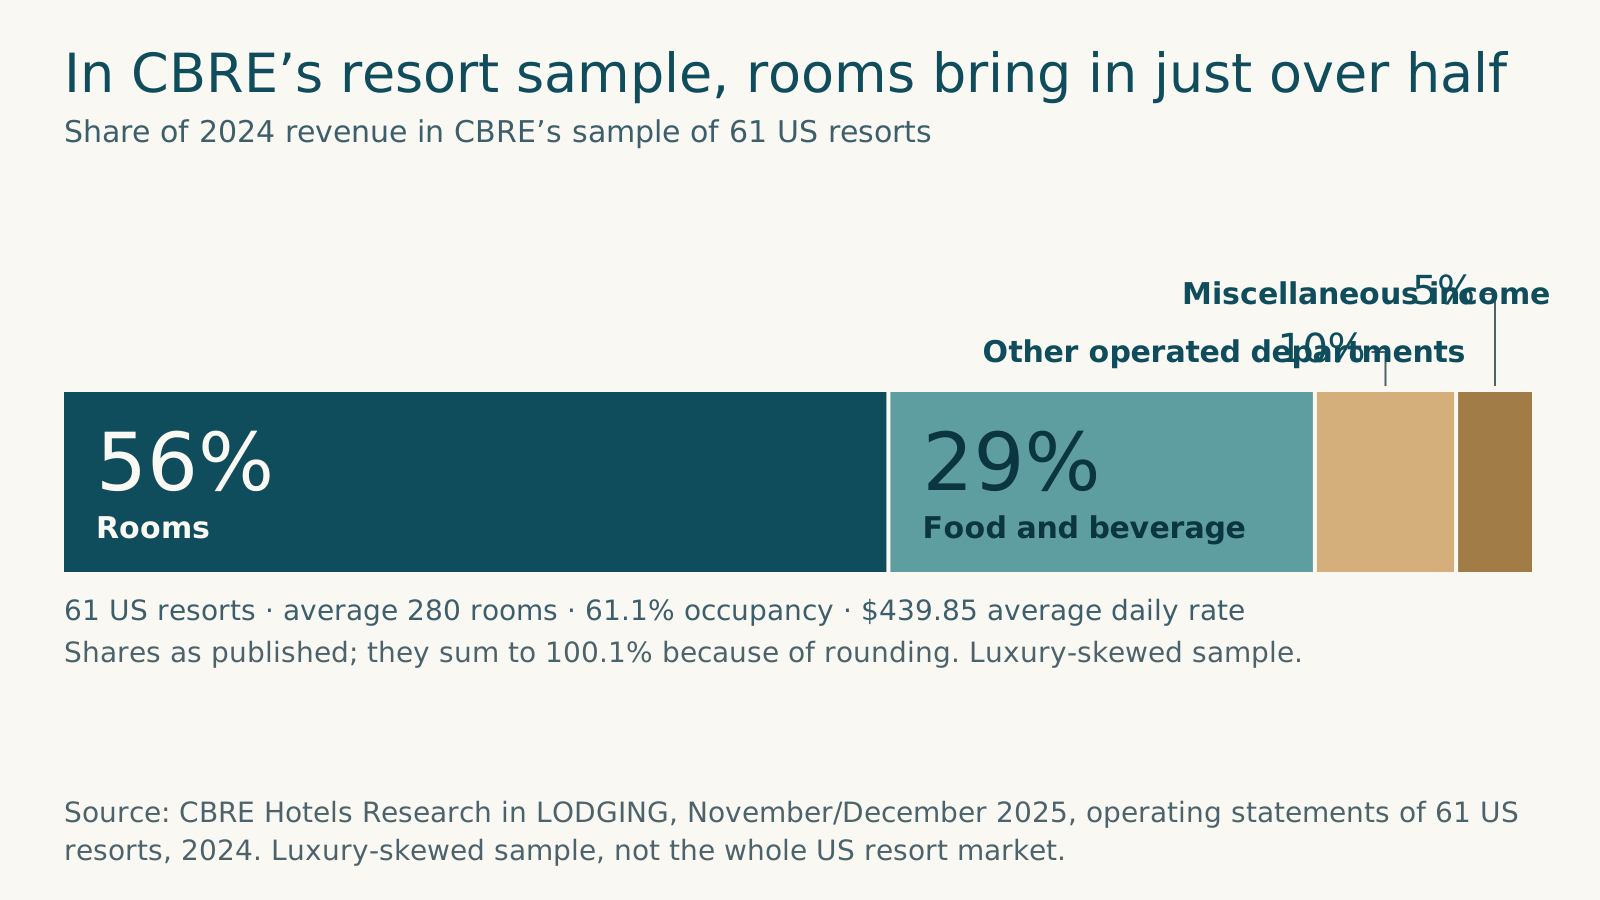
Figure 1. In CBRE’s resort sample, rooms bring in just over half. Source: CBRE Hotels Research in LODGING, November/December 2025, operating statements of 61 US resorts, 2024. Luxury-skewed sample, not the whole US resort market.
The growth. Across 2,216 US hotels of every type, total operating revenue rose 2.6% in 2025. Rooms grew 1.1%, F&B 4.3%, other operated departments 7.8% and miscellaneous income 10.9% (CBRE Trends via LODGING, May 2026). These are all-hotel figures; CBRE published no department growth for resorts alone. It did single resorts out on profit: "Among the six property categories tracked by CBRE, only resort and all-suite hotels achieved profit growth in 2025." It gave no percentage.
Food and beverage. In the first half of 2025, F&B revenue per occupied room rose 3.8%, "exceeding the 3.0% increase in total hotel revenue," across 866 full-service, resort and convention hotels (CBRE, November 2025). Banquet revenue rose 8.7% at resort hotels and fell 7.3% at convention hotels.
Other departments. Of 1,343 US full-service hotels with statements for 2019 and 2024, 1,116 "indicated key growth in other operated departments," a term CBRE does not define (CBRE, September 2025). Parking is the best documented of these lines. Resorts earned more from it than any other hotel type, $14.85 per occupied room in 2023, though that was just 1.9% of resort operating revenue (CBRE, 1,178 hotels).
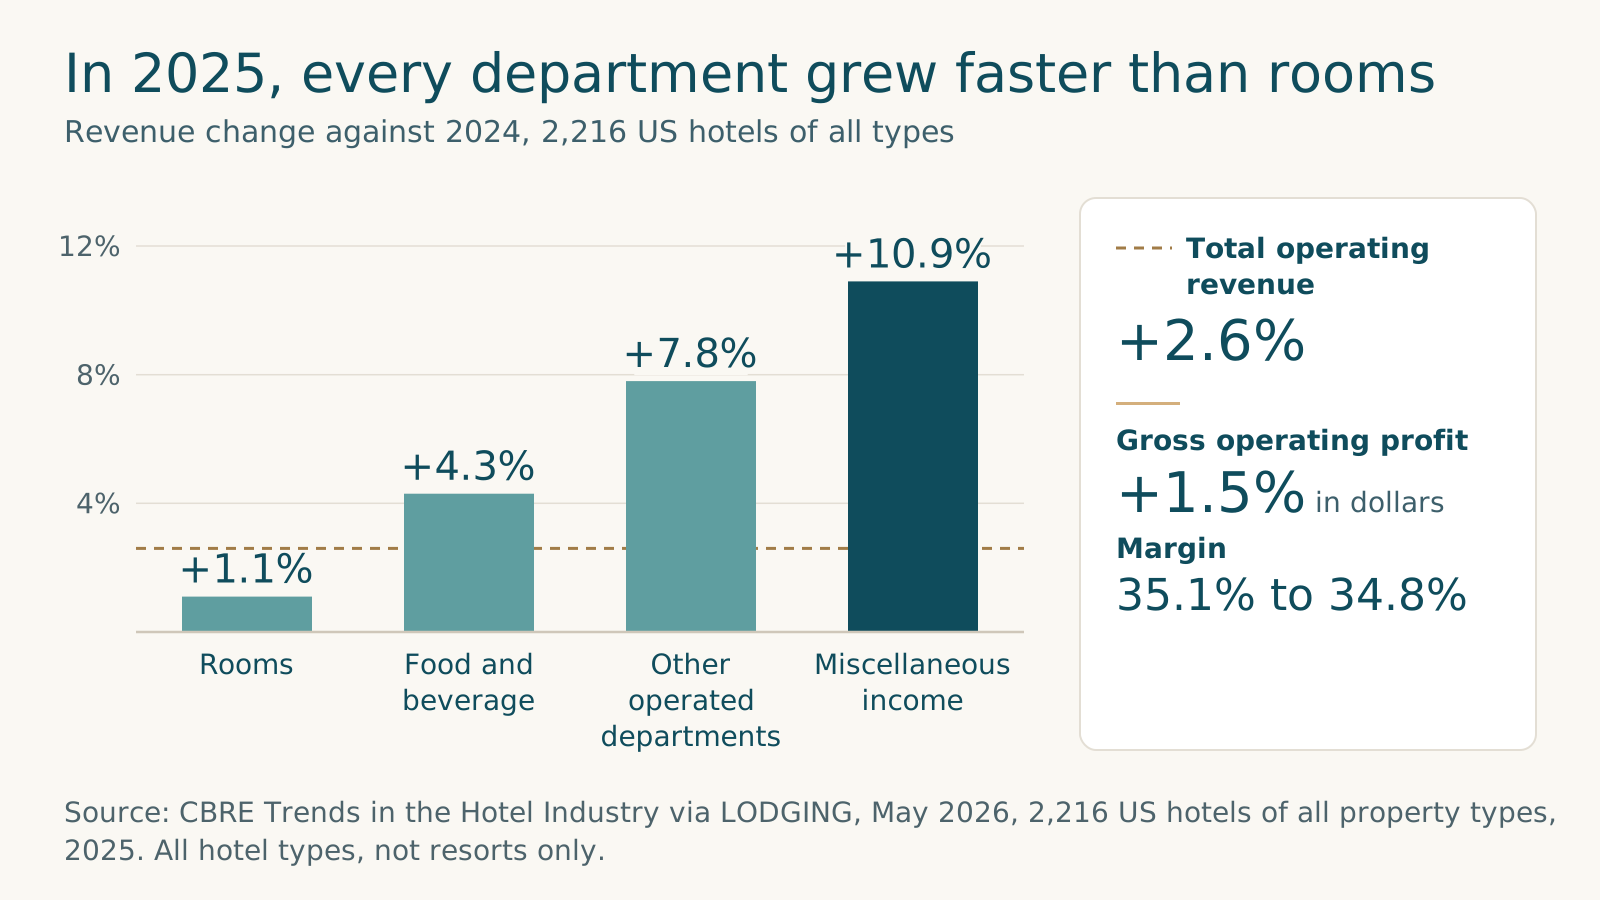
Figure 2. In 2025, every department grew faster than rooms. Source: CBRE Trends in the Hotel Industry via LODGING, May 2026, 2,216 US hotels of all property types, 2025. All hotel types, not resorts only.
When the money comes. For a seasonal resort, the year's profit is made in a few months. Summer seasonal resorts in CBRE's sample earned 59% of annual GOP in their peak summer months, and winter seasonal resorts 63% in their peak season (2024 data). Summer resorts ran 77% occupancy in July and 37.9% in January, and posted "the only negative monthly profit margin in our sample during January 2024."
Off-season, ancillary revenue does a different job. CBRE found that "Given the fixed nature of most sources of miscellaneous income, these sources of revenue were the least volatile." It read the off-season pattern as a sign "that resorts were effective in attracting local customers" "to use their spa, golf, and other recreational amenities during the off-season." That is CBRE's inference. It published no split between local and in-house spend.
Revenue grew; profit mostly did not
Revenue growth has not turned into profit growth, because labor has grown faster. In 2024, every extra $1 of US hotel revenue came with $1.04 of extra cost, $0.75 of it labor (HotStats). Departments keep very different shares of what they sell, so which line grows matters more than how fast the total grows.
Where the extra dollar went. HotStats, a benchmark owned by Duetto, a revenue management software company (LODGING, April 2025), analyzes monthly profit and loss (P&L) data from "thousands of hotels." It found US TRevPAR up 2.7% in 2024. "In 2024, for every $1 increase in top-line revenue, U.S. hotels faced a $1.04 increase in total costs." And: "Of that, $0.75 came from incremental labor expenses." Flow-through, the share of extra revenue that reaches profit, was negative 4%. In the Caribbean, labor took $0.50 of each extra dollar (HotStats via Hospitality Net, March and April 2025; sample size not disclosed, not resort-specific).
CBRE saw the same pattern in 2025. GOP rose 1.5% in dollars while the margin slipped from 35.1% to 34.8%, and labor cost per occupied room rose 2.9% (2,216 hotels).
Union and non-union. For January to August 2025, HotStats found that "for every dollar of incremental revenue, non-union hotels retain 25 cents in profit, while union hotels lose 1 cent" (HotStats via Hospitality Net, December 2025). If your resort is non-union, the 25 cents is your closer comparison. HotStats also set a hard line for budgets: "achieving even a modest boost in profit margins now requires at least a 5.0% increase in total revenue."
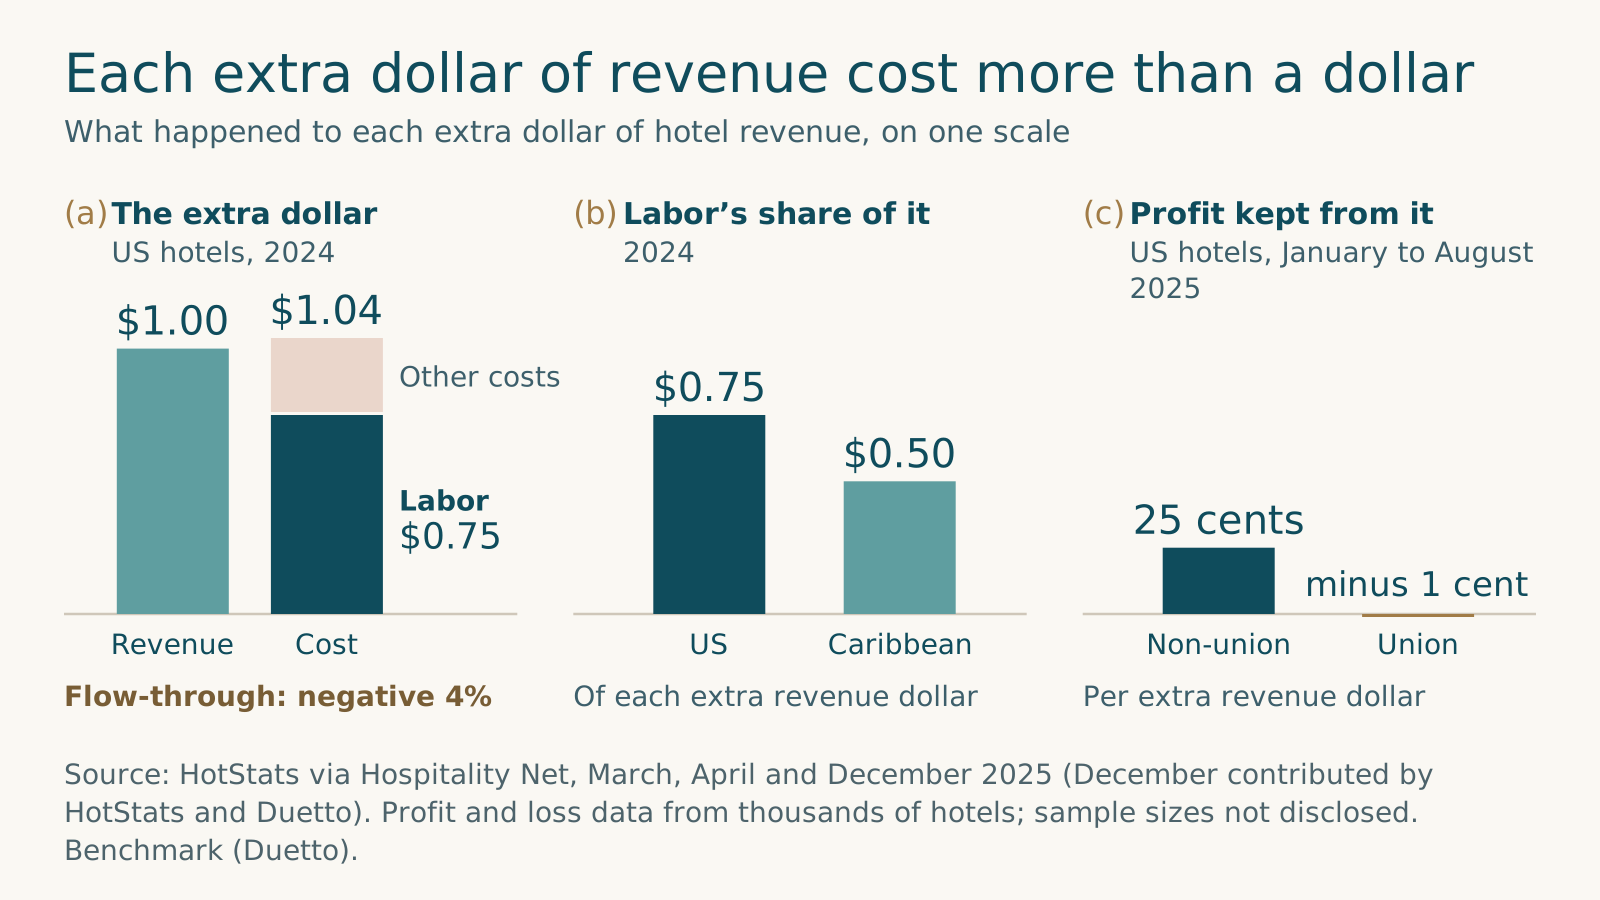
Figure 3. Each extra dollar of revenue cost more than a dollar. Source: HotStats via Hospitality Net, March, April and December 2025 (December contributed by HotStats and Duetto). Profit and loss data from thousands of hotels; sample sizes not disclosed. Benchmark (Duetto).
Departments keep different shares. CBRE calls rooms "typically the most profit-efficient" department. Outside rooms the spread is wide. Parking department profit was 61.3% of parking revenue in 2023, "while the average profit margin for all other-operated departments was 58.7% at those hotels" (CBRE, 1,178 hotels). The F&B department margin was 29.1% in the first half of 2025, and labor made up 59.4% of F&B department expenses (CBRE, 866 hotels). These come from different samples and years, so read them as rough levels. Even so, a dollar of new parking revenue and a dollar of new banquet revenue are not the same dollar.
The spa. CBRE's study of 297 US hotels with self-operated spas shows the pattern inside one department. In 2024, spa revenue grew 1.4%, total spa expenses 2.1% and spa labor 3.9%, while spa department profit fell 0.5% (CBRE via Hospitality Net, August 2025). Massages "represent upwards of 60% to 75% of the revenue generation and number of treatments," so a spa runs on therapist hours. It matters more at resorts: hotels in resort areas earned $6,539 of spa revenue per available room against $4,756 in urban areas. CBRE publishes no spa margin.
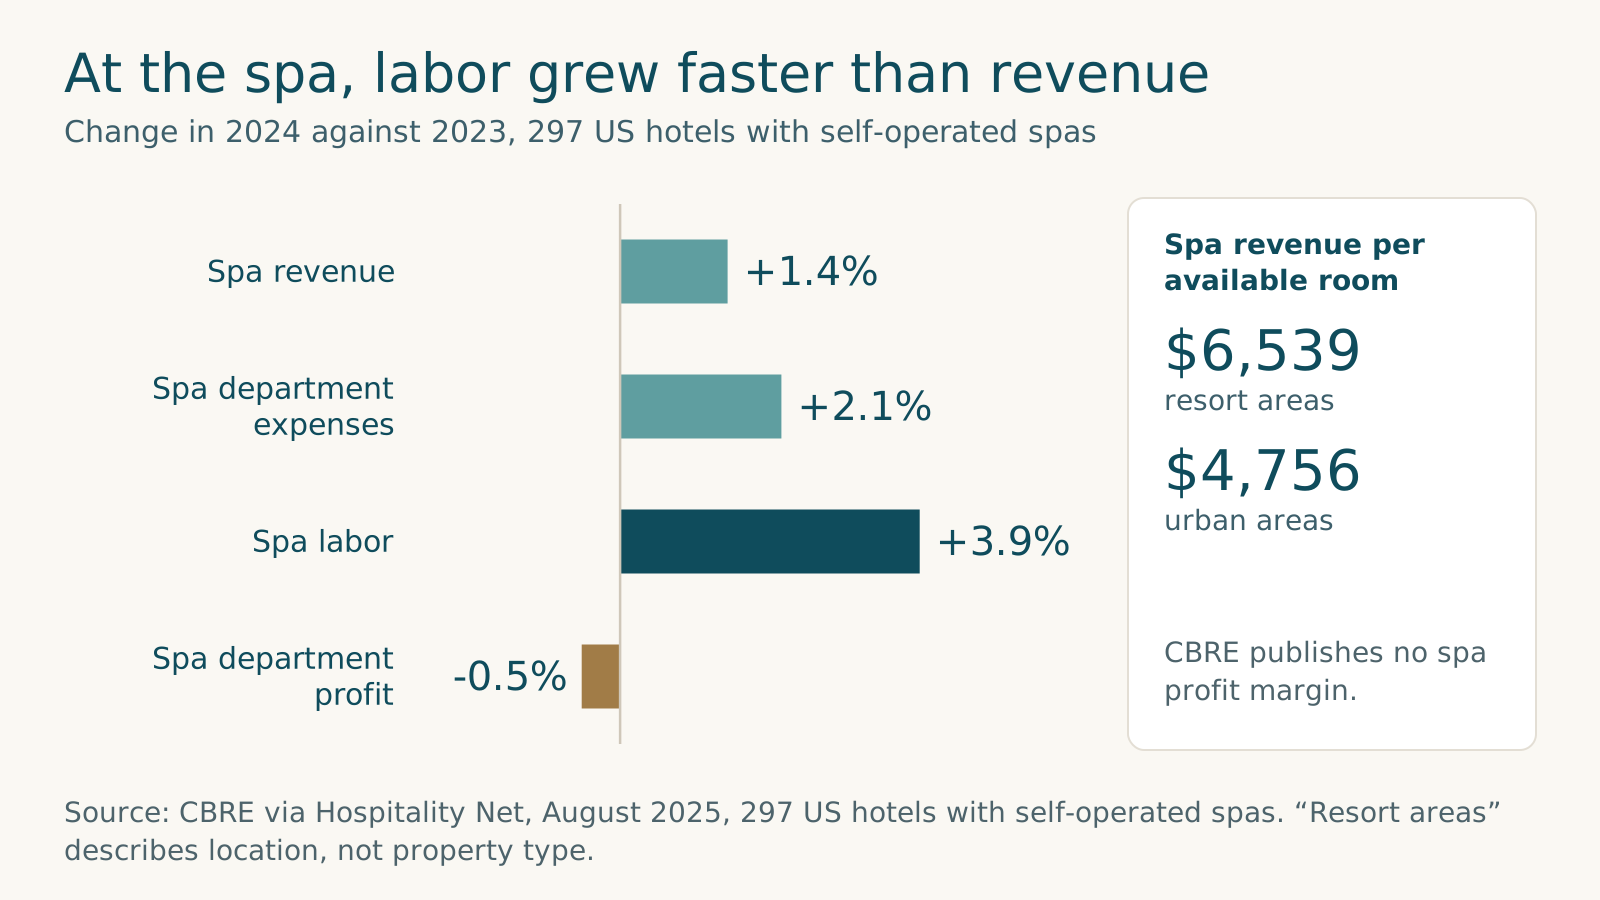
Figure 4. At the spa, labor grew faster than revenue. Source: CBRE via Hospitality Net, August 2025, 297 US hotels with self-operated spas. “Resort areas” describes location, not property type.
Same year, opposite answers. How hotels did in a given year depends on whose sample you read, and a GM should know that before quoting a benchmark to an owner. For 2024, CoStar reported US TRevPAR up 7.2% and gross operating profit per available room (GOPPAR) up 3.2%, with labor cost per available room up 11.2% (CoStar, February 2025). HotStats had TRevPAR up 2.7%, with margins and GOPPAR down.
For 2025, CBRE had total revenue up 2.6% and the GOP margin down to 34.8%. HotelData.com, a vendor platform that does not state its sample, reported TRevPAR down 8.8% and revenue per available room (RevPAR) down 6.3%, yet a GOP margin up 1.1 points to 38.3%, "supported by labor discipline" (February 2026). CoStar's rooms-only data had 2025 RevPAR down just 0.3% (CoStar, January 2026), so HotelData's platform hotels are clearly a different mix from the market CoStar tracks. HotelData also said "independents saw the largest margin compression," with no figure and possibly against budget.
None of these is wrong. They measure different hotels. The mistake is mixing them: compare your 2025 with one benchmark's 2024 and another's 2025, and you get a trend that never happened.
Which benchmark looks like you. Pick the sample closest to your property, use it for every year you compare, and name it when you share the number.
| If your resort is | Read first | Why |
|---|---|---|
| Large, high-rate and seasonal | CBRE's 61-resort study | A resort-only split from operating statements; averages 280 rooms and a $439.85 ADR |
| Full-service and non-union | HotStats non-union figures | Non-union hotels kept 25 cents of each extra dollar, January to August 2025 |
| Full-service and union | HotStats union figures | Union hotels lost 1 cent of each extra dollar over the same months |
| Independent and competing on price | HotelData.com, with care | Reports the largest margin compression at independents and ancillary spend softening; sample not stated |
| Any property, rooms only | CoStar | Market direction on occupancy, ADR and RevPAR; no resort split |
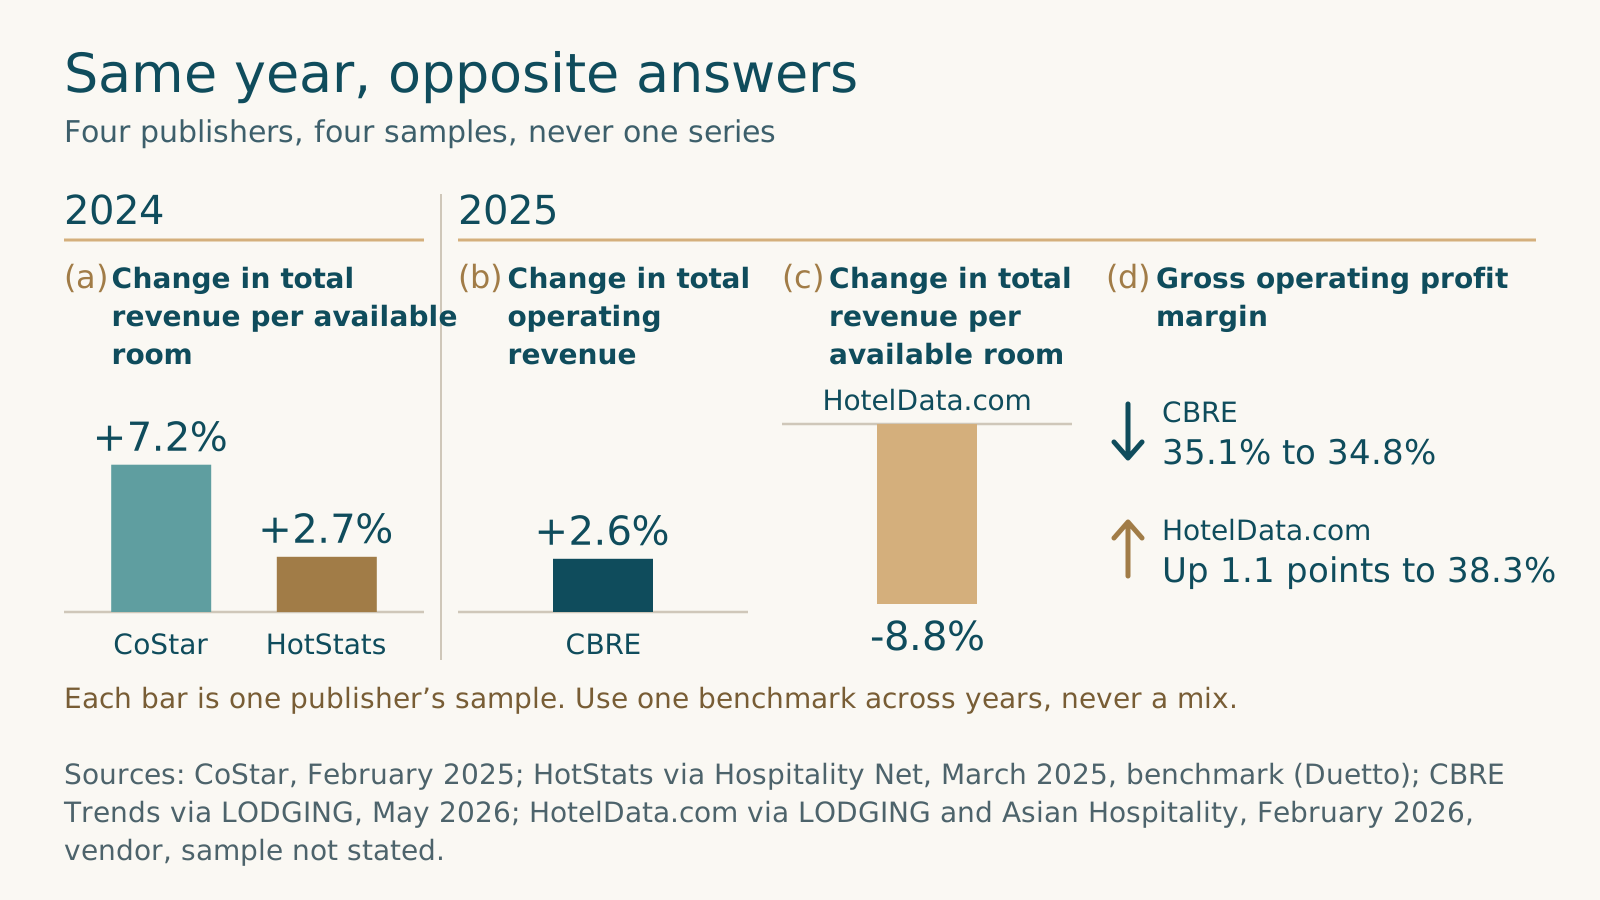
Figure 5. Same year, opposite answers. Sources: CoStar, February 2025; HotStats via Hospitality Net, March 2025, benchmark (Duetto); CBRE Trends via LODGING, May 2026; HotelData.com via LODGING and Asian Hospitality, February 2026, vendor, sample not stated.
Guests buy time, and they buy it close to the day
The extras guests actually pay for are simple, and they buy them late. In the most detailed recent upsell dataset, early check-in and late checkout made up 90% of upsell revenue and the most common price paid was $50 (Akia, August 2026, vendor data). In a separate Akia post, 42% of early check-ins were bought on the arrival day itself (June 2026, sample not stated).
What sells. Akia analyzed 4,729 completed, paid upsell transactions worth $370,625, sold "across roughly two dozen hotel and vacation rental operators" in the 12 months ending July 2026. Early check-in alone was 58% of upsell revenue. Early check-in and late checkout together were 90% of revenue and 96% of sales. Prices are "what the guest actually paid, not what was listed," most often $50 and next most often $100 (Akia, August 2026). Early check-in sold for anything from $20 at a budget motel to above $250 at a luxury boutique, while room upgrades "barely registered."
Two limits apply. Hotels and vacation rentals are pooled with no split, and menus likely varied by operator (our reading; Akia does not say). F&B, parking and spa items do not appear at all. With a wider menu the ranking changes. Across thousands of properties in more than 85 countries in summer 2024, the top upsells by revenue were breakfast, extra nights, parking, late checkout and early check-in, in that order (Mews Data Snap, November 2024, vendor, global; ranking only, no shares or prices).
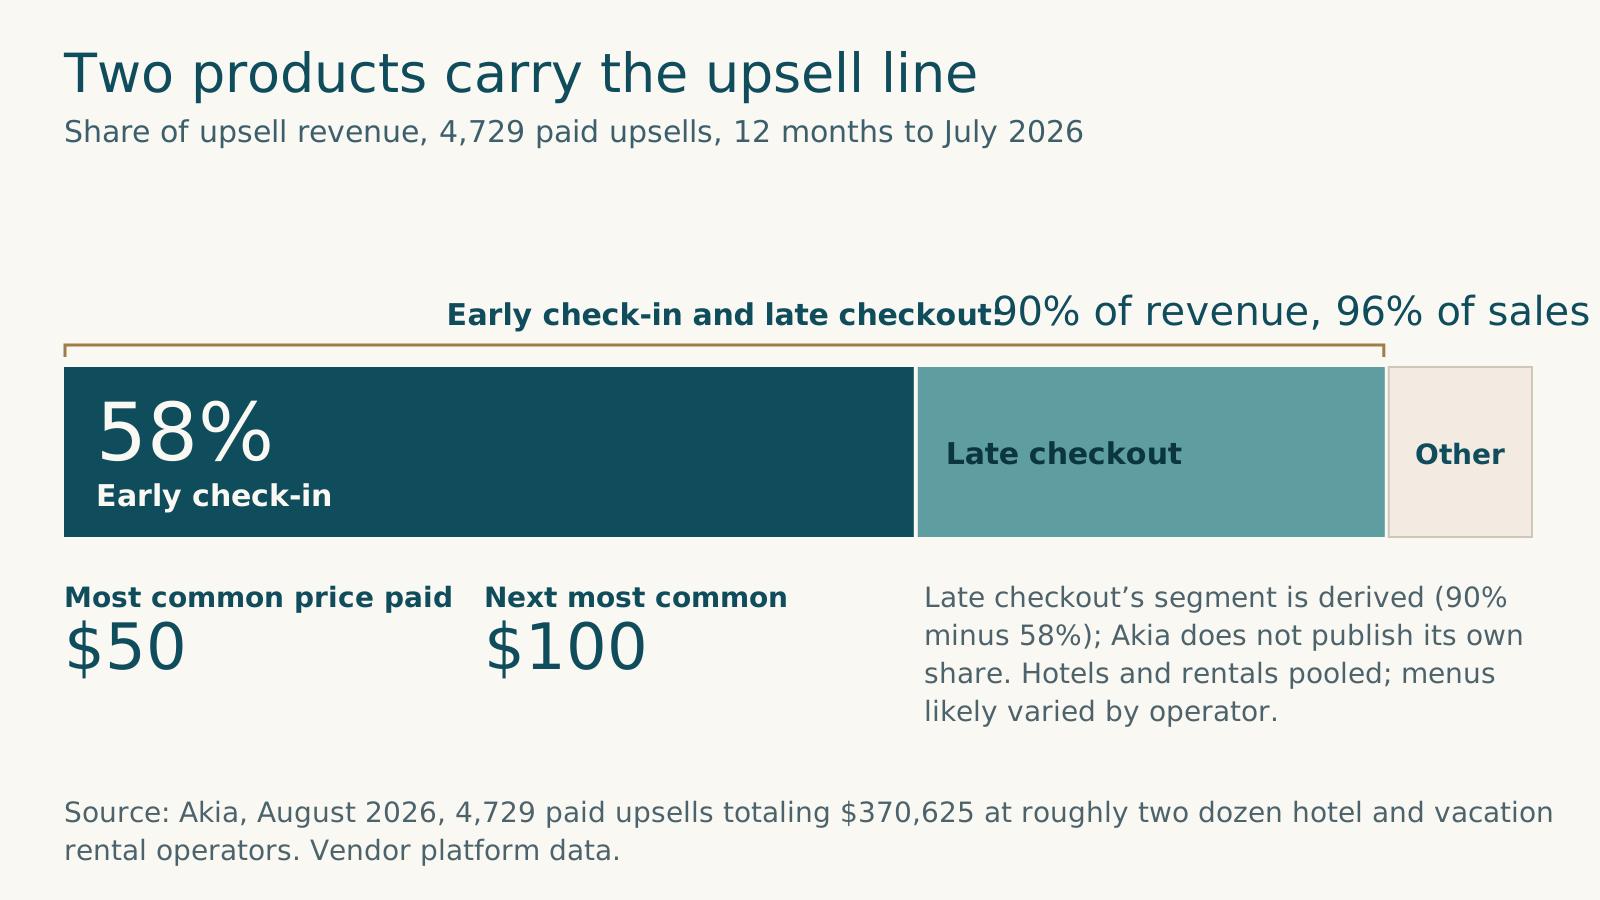
Figure 6. Two products carry the upsell line. Source: Akia, August 2026, 4,729 paid upsells totaling $370,625 at roughly two dozen hotel and vacation rental operators. Vendor platform data.
Who buys. Purchase rates are low. Measured against all stays at properties running upsells, 1.59% of stays bought one. Same-day arrivals bought on 0.89% of stays and guests who booked 31 to 60 days ahead on 3.66%, "roughly four times as often" (Akia, August 2026). Groups of seven or more bought on 5.3% of bookings, solo travelers on 1.5% (Akia, June 2026). One caution: the August article also reports a review sample of 1,229 buyers in 40,590 stays, which implies a higher rate, and it does not reconcile the two. Akia's finding that upsells "raised effective ADR by as much as 15% for a guest who bought one" applies to buyers, not to the property.
When they buy. Of early check-in purchases, 42% happened on the arrival day and about 82% in the final week before arrival. Of late checkout purchases, 49% happened on the departure day (Akia, June 2026, sample not stated).
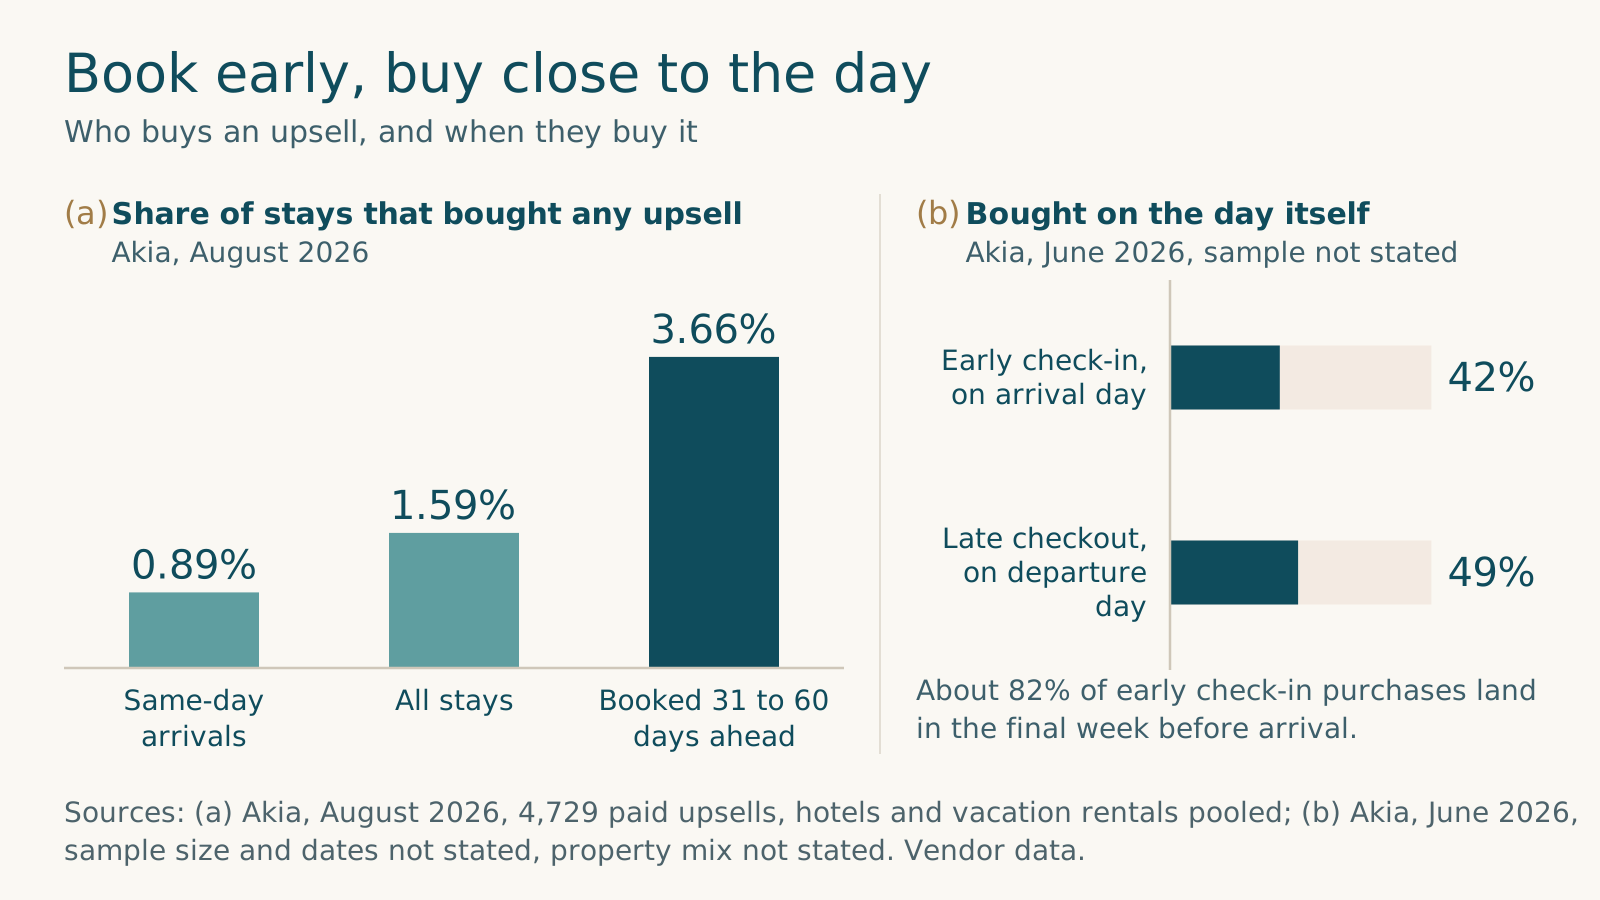
Figure 7. Book early, buy close to the day. Sources: (a) Akia, August 2026, 4,729 paid upsells, hotels and vacation rentals pooled; (b) Akia, June 2026, sample size and dates not stated, property mix not stated. Vendor data.
What guests say they would pay for. Surveys run well ahead of purchases, so treat them as a ceiling. In a 2022 survey of 5,266 consumers in nine countries, 37% said they would pay extra to check in early or check out late (Oracle Hospitality with Skift, vendor). In a SiteMinder survey of more than 12,000 travelers in 14 markets, published in November 2024, 47% said they would spend extra on breakfast (vendor). Both are global.
Two products, one promise. Early check-in and late checkout are products made from a clean room and a housekeeping schedule. An early check-in sold at 10am promises that a specific room will be ready. A late checkout sold at 8am on departure day promises that a room will not be turned until later, which matters most when that room has an arrival the same day. We found no public source that publishes a late checkout price ladder, take rates by hour, or how often requests are refused because of the next arrival.
Four rules for selling early check-in and late checkout
- Give each one a posted price. One or two price points, written down, so anyone on the team can say yes in a sentence. In Akia's data the most common price paid was $50 (vendor, hotels and rentals pooled).
- Offer them when guests decide. Send the offer in the final week before arrival and again on the day. About 82% of early check-in purchases came in that final week, and 49% of late checkout purchases on the departure day.
- Confirm only what the room plan can keep. Check each early check-in against the cleaning order and each late checkout against same-day arrivals before saying yes. A broken promise at the door undoes the sale.
- Count the refusals. Log every request you turn down and why. That is the size of the product you are not yet selling, and no public source we found measures it for you.
Direct guests book bigger, but no current public data shows what they spend on property
Direct bookings are worth more per booking, cancel less and come back more often, in each vendor dataset that splits them out. Whether direct guests also spend more once they arrive is the question owners ask most, and no current public source answers it.
Booking value. Hotel websites generated an average of $516 per booking in 2025, against $445 for wholesalers, $392 for global distribution systems and $312 for OTAs (SiteMinder Hotel Booking Trends, over 140 million reservations in 20 destinations, vendor, global). Mews found a similar gap in summer 2024: €406 for a typical direct booking engine reservation, against €279 through a channel manager, which is not the same thing as an OTA (vendor, global). Both are per booking, so they blend length of stay, room type and anything added to the reservation. Neither measures spend on property.
Cancellations. At independent hotels in 2025, OTA bookings were cancelled at 21.8%, "more than double the 10.6% rate for direct bookings," and OTAs took 63.4% of bookings (Cloudbeds, 90 million bookings in 180 countries, vendor, global).
Return visits. Among 2.2 million guests at European hotel groups from 2024 to 2026, direct guests returned at 5.1% and OTA guests at 1.3%. OTAs brought in 65% of first stays, but direct bookings made up 68% of repeat stays (Bookboost, July 2026, vendor, Europe; return window not defined).
Net revenue. Kalibri, which analyzes transaction data from "more than 35,000 hotels across 100-plus brands," reports a "$28 net revenue advantage per booking for Brand.com loyalty over OTA" (LODGING, July 2026, vendor). A brand's loyalty website is not an independent's own site.
The pre-arrival window. In Mews data for summer 2024, 1 in 10 OTA guests used online check-in, against 1 in 3 who booked direct through the Mews booking engine (vendor, global). That is a chance to make an offer before arrival, but Mews did not measure what either group bought.
What is known about spend by channel. Two pieces of evidence come close, and neither answers the question. Akia's upsell data splits purchase rates by channel: Vrbo 2.95%, Airbnb 2.76%, Expedia 0.87% and Booking.com 0.86% of stays (vendor). It has no row for direct bookings, and the Vrbo and Airbnb rows are likely to be mostly vacation rentals. The last published attempt to tie ancillary spend to channel dates from 2016, when Kalibri Labs, drawing on its database of more than 25,000 hotels, found direct bookings more profitable "to the tune of 9 percent," and said profitability "can be almost 18 percent better" once ancillary spend is included (Hospitality Upgrade via Hotel-Online, vendor data, unnamed author, analysis period not stated).
The open question. Do direct guests spend more on property than OTA guests? No current public data says. The booking-level gap could come from longer stays and bigger rooms as easily as from more dinners and treatments. A resort that tags every folio by booking channel can measure it, and the scorecard at the end shows how.
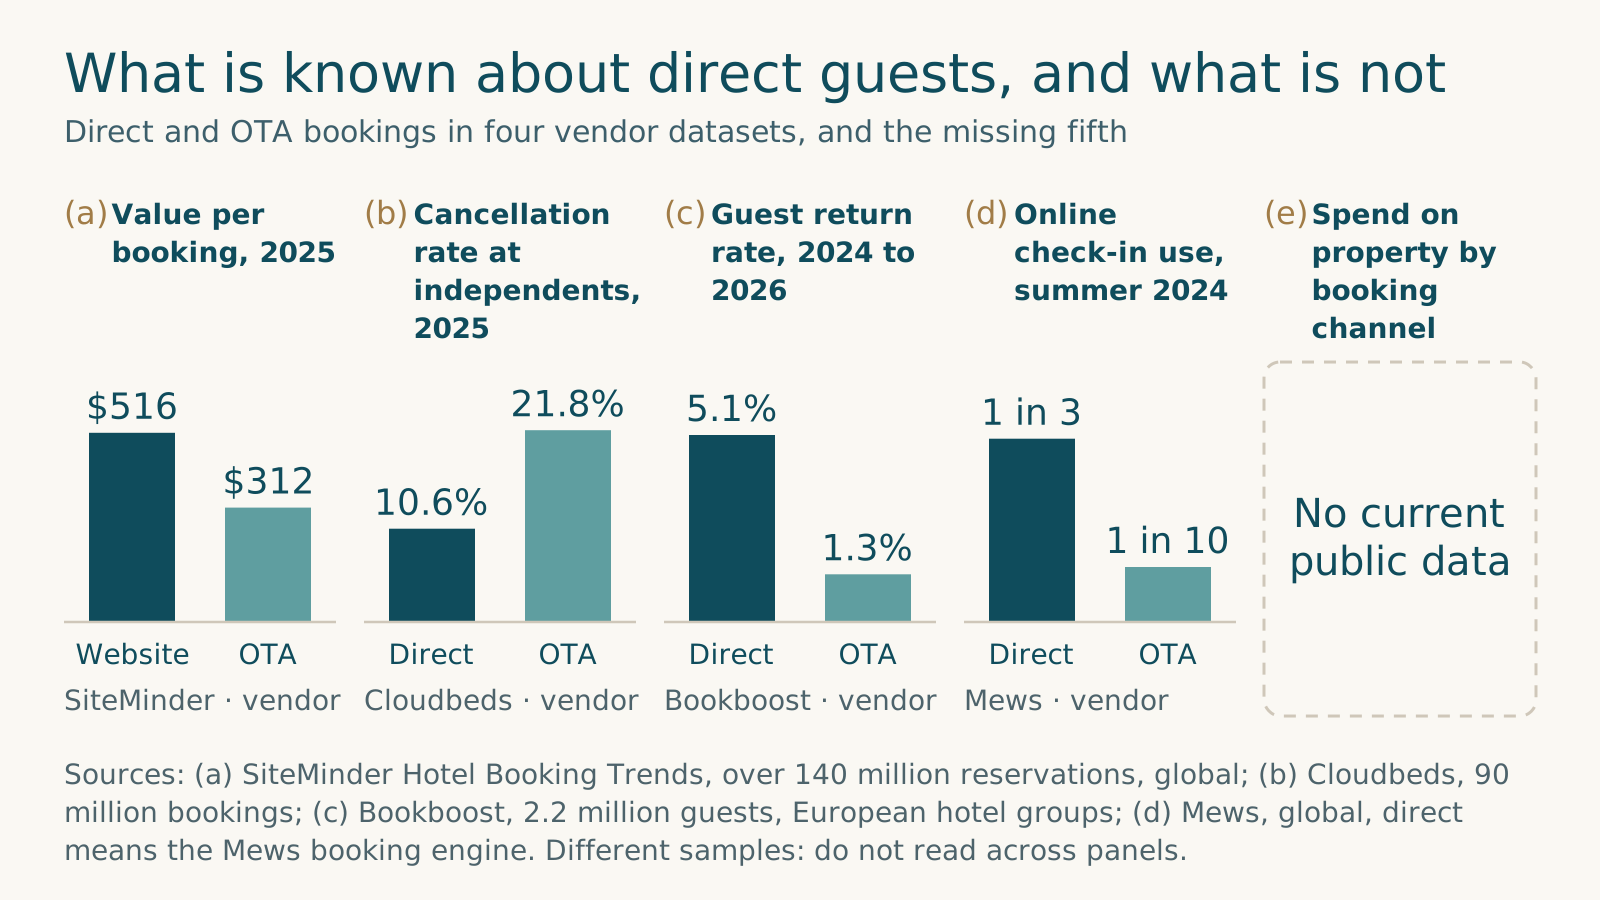
Figure 8. What is known about direct guests, and what is not. Sources: (a) SiteMinder Hotel Booking Trends, over 140 million reservations, global; (b) Cloudbeds, 90 million bookings; (c) Bookboost, 2.2 million guests, European hotel groups; (d) Mews, global, direct means the Mews booking engine. Different samples: do not read across panels.
After the fee rule, the total price is the price
Since May 12, 2025, US lodging businesses have had to show the total price, including mandatory fees such as resort fees, whenever they show a price. Optional extras can still be priced separately. What resorts have done with their fees since then has not been measured in any public dataset.
This is general information, not legal advice.
What the rule covers. The Federal Trade Commission (FTC) rule on unfair or deceptive fees, Part 464 of Title 16 of the Code of Federal Regulations (16 CFR Part 464), took effect on May 12, 2025. It covers live-event tickets and "temporary sleeping accommodations at a hotel, motel, inn, short-term rental, vacation rental, or other place of lodging." Total price means "the maximum total of all fees or charges a consumer must pay for any good(s) or service(s) and any mandatory ancillary good or service." In summary, the rule asks three things of any offer, display or advertisement that shows a price. First, the total price must be shown "more prominently than any other pricing information," and where the final amount of payment is shown, that amount must be at least as prominent as the total price. Second, before the guest agrees to pay, any fee left out of the total must be disclosed clearly and conspicuously, with its nature, purpose and amount and the good or service it is charged for. Third, the final amount of payment for the transaction must also be shown before the guest agrees to pay. The rule also bars misrepresenting "the nature, purpose, amount, or refundability of any fee or charge." The federal regulation text, up to date as of October 15, 2026, shows the rule still in force.
What it leaves outside the total. In the FTC's words, "The rule does not require that all fees be included when offering a price," only the mandatory ones. Government charges and optional add-ons can still be shown separately. The commercial line follows: an extra the guest is free to decline sits outside the total, and a charge every guest must pay sits inside it.
The last benchmark is from 2018. The most recent independent resort fee data predates both the pandemic and the rule. In 2018, "50.8 percent of the resort hotels in the CBRE sample charged a resort fee, versus 2.8 percent for all other hotel types." At resorts that charged one, fee revenue averaged 3.6% of total revenue (CBRE in LODGING, February 2020, 6,300 statements; 306 reporting fee revenue).
Why the P&L will not tell you either. The 11th edition of the Uniform System of Accounts for the Lodging Industry (USALI) "mandates that all resort fee revenue be recorded as miscellaneous income in the summary operating statement." Miscellaneous income grew 10.9% in CBRE's 2025 all-hotel data, the largest gain of any line CBRE reports. CBRE mentions resort and destination fees in the same passage but gives no figure for them. Do not read it as fee growth.
What happened after May 2025. Only snapshots exist. In an undated article on the new rule, the Las Vegas Review-Journal found that "Many of the websites selling hotel rooms at Las Vegas resorts complied immediately," while MGM's calendar showed room rates only, "with a note referencing the resort fee." Those are casino resorts. A consumer-press check of 160 hotels worldwide found 30 charging resort fees, averaging $33 a day (NerdWallet, updated October 2026; check-in year not stated). Peachtree Group's president of hospitality management describes hotels "bundling fees into the overall pricing," while a Las Vegas broker says "Resort fees aren't going anywhere" (Hospitality Investor, April 2026). No dataset measures how many resorts kept, dropped or folded fees into rate, or what that did to conversion.
What it means for in-stay offers. A mandatory fee is no longer an add-on. It is part of the rate the guest compares with every other listing. The extras that remain are the ones a guest can say no to, so each has to earn its yes on price and timing.
Keeping more of each in-stay dollar
For a resort with 40 to 400 rooms, the evidence argues for a short list of offers, sold close to the moment at a simple price, with every department judged on what it keeps after labor. Revenue that costs more to deliver than it brings in is not growth.
Start with the two products guests already buy, because both are made from rooms you already have. Put each department's profit after labor beside its revenue in the monthly owner report; when spa revenue grows 1.4% and spa labor 3.9%, the revenue line hides the profit drop (CBRE, 2024). Keep peak offers few and quick to deliver, since peak is when the team has the least slack. Before building a shoulder-season program on CBRE's reading that locals use the spa and golf off-season, test it with your own POS data. Then answer the channel question with your own folios, because no one else has.
Six decisions for next season
| Decision | What the evidence says | First step |
|---|---|---|
| Make early check-in and late checkout posted products | 90% of upsell revenue; most common price $50 (Akia, vendor) | Set one or two prices and add them to pre-arrival messages |
| Offer close to the day | 42% of early check-ins bought on arrival day; 49% of late checkouts on departure day (Akia, vendor) | Schedule offers for the final week and the day itself |
| Judge every department after labor | Labor took $0.75 of each extra US revenue dollar in 2024 (HotStats); spa profit fell as revenue rose (CBRE) | Add department profit after labor to the monthly owner report |
| Protect the peak, test the shoulder | 59% and 63% of annual GOP earned in peak season (CBRE, 61 resorts, 2024) | Price peak ancillaries first; test one local offer in the slowest month |
| Measure spend by channel | No current public data on on-property spend by channel | Report ancillary revenue per occupied room for direct and OTA guests each quarter |
| Price the total | FTC rule in force since May 12, 2025 | Review every price display for mandatory fees (general information, not legal advice) |
Self-check
How well does your property capture in-stay revenue?
Seven quick questions drawn from the scorecard in this report. It takes about a minute, and nothing you enter is saved.
- Do early check-in and late checkout each have a posted price?
- When do guests get those offers?
- When you turn down a late checkout request, do you log it?
- Does your monthly owner report show each department’s profit after labor?
- Do you know your revenue mix by month, for peak and off-peak?
- Can you show ancillary revenue per occupied room for direct and OTA guests?
- Wherever you show a room price, does it include every mandatory fee?
Test your own property: the two-hour ancillary scorecard
You can fill in this scorecard in about two hours from reports you already run. Where a published benchmark exists, the printable scorecard in the PDF sets it beside your number. Where none exists, your own trend is the benchmark.
Before you start. Use the last 12 complete months, then repeat for your three busiest and three slowest months. These definitions keep the numbers sound when you share them with an owner:
- Ancillary revenue per occupied room: all revenue outside rooms (F&B, other operated departments and miscellaneous income) divided by occupied room nights.
- Capture rate by outlet: stays with at least one charge at an outlet, divided by all stays. Charges paid at the outlet rather than posted to the room will be missing, so note how much revenue that leaves out.
- Take rate: early check-ins (or late checkouts) sold, divided by stays.
- Contribution margin after labor: department revenue minus cost of sales and all department labor, including contract labor, divided by department revenue.
1. Rooms. From the PMS: occupied room nights and stays by month, split by booking channel.
2. Outlets. From the POS and the P&L: revenue by outlet and month, plus the folio postings that show which stays used each outlet.
3. Labor. From payroll: labor by department, including contract and agency labor.
4. Early check-in and late checkout. The number sold, the price paid, when each was bought and any requests turned down.
5. Score. Write your number beside each check on the printable scorecard in the PDF, which sets each check beside its published benchmark where one exists, and keep the sheet for next season.
Run it twice a year, before peak and after it. The channel line is the number owners ask about most, and right now only your own folios can produce it.
The full report
The In-Stay Revenue Report
What operators are saying
None of the public voices on in-stay revenue are GMs or owners of independent resorts. The quotes below come from a branded lodge, a hotel group, a management company, a broker and a vendor, and we label each.
Williamsburg Lodge, Autograph Collection (branded, 323 keys). Curtis LeBarron, rooms operations manager: "We didn't track upsells well before. I'd estimate that we probably generated $5,000 a year." Source: Canary Technologies case study on Hotel Tech Report. Vendor case study; the page notes it has not yet been verified by the property.
Postillion Hotels, Netherlands (hotel group). Manon Klop, revenue manager: "We can now offer extra products, like an early check-in without any hassle, but with extra revenue." Source: Mews press release, November 2023. Vendor.
Peachtree Group (management and investment company). Vickie Callahan, president of hospitality management: "Hotels are looking more at overall pricing and bundling fees into the overall pricing..." And: "Owners and investors understand the strategy behind these fees, so they will likely remain in place..." Source: Hospitality Investor, April 2026. Editorial.
Colliers Las Vegas (broker). Mike Mixer, chairman: "Resort fees aren't going anywhere." And: "Transparency refines the model." "It doesn't weaken it." Source: Hospitality Investor, April 2026. Editorial.
For balance: Actabl (the vendor behind HotelData.com). Sarah McCay Tams, head of research: "Hotels serving affluent travelers are in a fundamentally different business right now than those competing on price." Source: Asian Hospitality, February 2026. Vendor.
The most telling line may be the first one. Before anything else changed, the lodge was not tracking what it sold.
How we built this report
This edition is a synthesis of published evidence.
What we looked for. Operating statement benchmarks for revenue mix and department profit, platform data on upsells and booking channels, traveler surveys, and the federal fee rule with reporting on how resorts responded. We preferred work from 2022 to 2026; older studies carry their year.
How we checked it. Every figure was taken from a source page that was opened and read, not from a search result, and then checked again in a separate pass by a checker who had no hand in writing the report. That pass rechecked each figure and quote against its live source page. Where a figure was read in a republication or summary rather than the original, the sentence or the Sources entry says so ("via ..."). We dropped claims we could not trace to a primary source or that contradicted themselves, including widely repeated upsell lift percentages, an OTA acquisition cost multiple from 2017, a commonly cited OTA commission range, and an association figure for resort spa spend that two trade outlets reported differently.
How to read it.
- Vendor data is labeled. Much of the best recent upsell and channel data comes from technology companies' platforms. It describes their customers, not the whole industry.
- Samples skew large and luxury. CBRE's resort mix describes its 61-resort sample (280 rooms and a $439.85 ADR on average), not US resorts as a whole. No public dataset isolates independents with 40 to 400 rooms.
- Benchmarks disagree. We name whose sample every figure comes from and never chart figures from different benchmarks as one series. CBRE's 2025 department growth rates cover all hotel types.
- Akia's August 2026 upsell data pools hotels and vacation rentals, and its headline attach rate does not reconcile with the same article's review sample. Its June 2026 post on purchase timing states no sample. We use both with those labels and never as one dataset.
- Per booking is not per guest on property. Booking value, cancellations and return rates by channel are verified; spend on property by channel is not published anywhere current. Surveys measure stated willingness, not purchases.
- Known gaps: what resorts did with fees after May 2025, late checkout price ladders and refusal rates, spa department margins, and the local and in-house split of off-season spend.
Sponsor. This report is published by ResortConcierge AI, which makes guest communication software for independent resorts. The product appears only in the About section and the closing invitation.
About ResortConcierge AI
Independent resorts lose guests in the gap between a question and an answer, usually when the desk is busiest or empty. ResortConcierge AI is an AI concierge built for those properties: it helps answer routine guest questions, routes service requests to the right team and flags unhappy guests early, all in one shared inbox, so staff can spend their time on the guests in front of them.
Want to see where your in-stay revenue goes?
Fill in the ancillary scorecard from this report, then walk through your results with us in a private, free 20-minute review.
Get the next report first
ResortConcierge AI Research publishes on the operating questions independent resorts ask most. One email when each report is out.
More from the series

Frequently asked questions
How much of a resort’s revenue comes from rooms?
In CBRE’s 2024 sample of 61 US resorts, rooms brought in 56% of revenue, food and beverage 29%, other operated departments 10% and miscellaneous income 5%. The resorts averaged 280 rooms and a $439.85 average daily rate, so the sample leans luxury.
Which hotel departments grew fastest in 2025?
Across 2,216 US hotels of all types, CBRE found miscellaneous income up 10.9%, other operated departments up 7.8%, food and beverage up 4.3% and rooms up 1.1%, against 2.6% for total operating revenue.
What upsells do hotel guests actually buy?
In Akia’s data on 4,729 paid upsells at roughly two dozen hotel and vacation rental operators, early check-in and late checkout made up 90% of upsell revenue and 96% of sales. The most common price paid was $50 (vendor data, August 2026).
When do guests buy early check-in and late checkout?
Close to the day. In an Akia post from June 2026, 42% of early check-ins were bought on the arrival day and about 82% in the final week before arrival, and 49% of late checkouts were bought on the departure day (vendor data, sample not stated).
Do direct-booking guests spend more on property than OTA guests?
No current public data says. Direct bookings are worth more per booking ($516 on hotel websites against $312 through online travel agencies in SiteMinder’s 2025 data), cancel less and return more often in vendor datasets, but none measures spend on property by booking channel.
Do resort fees have to be included in the advertised price?
Since May 12, 2025, the FTC’s rule on unfair or deceptive fees has required US lodging businesses to show the total price, including mandatory fees such as resort fees, whenever they show a price. Optional extras and government charges can still be shown separately. This is general information, not legal advice.
Is this report based on independent resorts only?
No. No public dataset isolates independent resorts with 40 to 400 rooms. The report draws on resort, all-hotel and vendor data and labels each source.
Sources
All pages opened October 17 and 18, 2026. Vendor means the publisher sells hospitality or communications technology.
- Akia, Which hotel upsells sell best: two offers take 90% of the revenue, August 2026, 4,729 paid upsells at roughly two dozen hotel and vacation rental operators, 12 months to July 2026 (vendor)
- Akia, Early check-in and late checkout: when guests actually buy them, June 2026, a year of upsell purchases, sample not stated (vendor)
- Bookboost, Direct booking guests return at 4x the rate of OTA guests: what the data shows, July 2026, 2.2 million guests at European hotel groups (vendor)
- Canary Technologies via Hotel Tech Report, Williamsburg Lodge success story, undated, one branded hotel (vendor case study, not verified by the property)
- CBRE Hotels Research in LODGING, The Impact of Seasonality (Robert Mandelbaum and Ryan Foreman), page 22, page 23 and page 24, November/December 2025, 61 US resorts, 2024 operating statements (independent research)
- CBRE via LODGING, Profitability under pressure: how 2025 U.S. hotel performance reshapes valuation underwriting, May 2026, 2,216 US hotels (independent research)
- CBRE, Hotel food and beverage: a bright spot in 2025, November 2025, 866 full-service, resort and convention hotels (independent research)
- CBRE, Finding revenue beyond rooms and F&B, September 2025, 1,343 US full-service hotels (independent research)
- CBRE, Parking and EV stations charge US hotel performance, September 2024, 1,178 US hotels (independent research)
- CBRE via Hospitality Net, The role of hotel spa departments, August 2025, 297 US hotels with self-operated spas (independent research)
- CBRE in LODGING, A matter of transparency: resort fees are a growing source of revenue, February 2020, 6,300 US statements, 2018 data (independent research, seminal)
- Cloudbeds, 2026 State of Independent Hotels report, March 2026, 90 million bookings in 180 countries (vendor)
- CoStar, U.S. hotel profits grew in 2024 but were limited by inflation and labor costs, February 2025, P&L sample size not stated (independent research)
- CoStar, US hotels report first full-year occupancy and RevPAR declines since 2020, January 2026, sample not stated (independent research)
- eCFR, 16 CFR Part 464, Rule on Unfair or Deceptive Fees, up to date as of October 15, 2026 (government)
- Federal Register via GovInfo, Trade Regulation Rule on Unfair or Deceptive Fees, final rule, January 2025 (government)
- Hospitality Investor, Hotels reengineer pricing for a transparent market, April 2026 (editorial)
- Hospitality Upgrade via Hotel-Online, Just the facts ma'am: direct bookings are 9% more profitable for hotels, May 2016, Kalibri Labs database of more than 25,000 hotels (vendor data via editorial, seminal)
- HotelData.com via LODGING, New report finds decline in TRevPAR and RevPAR at U.S. hotels in 2025, and via Asian Hospitality, Report: hotel performance slows, divide grows, February 2026, platform sample not stated (vendor)
- HotStats via Hospitality Net, Moving beyond RevPAR to maximize profitability, March 2025; Navigating uncertainty: Profit Matters in the US hotel market, April 2025; US hotels face profit pressure as labor costs outpace recovery, December 2025 (contributed by HotStats and Duetto); thousands of hotels, sample sizes not disclosed; benchmark (Duetto), owned by a revenue management software company
- Kalibri via LODGING, From data to direction: hotels need technology that helps calculate the most profitable mix of business, July 2026, more than 35,000 hotels across 100-plus brands (vendor)
- Las Vegas Review-Journal, Richard N. Velotta, How are Las Vegas resorts responding to new FTC "junk fee" rule?, undated (no publication date on the page), Las Vegas Strip resort websites (editorial)
- LODGING, Duetto announces acquisition of HotStats, April 2025 (trade press; ownership of HotStats)
- Mews via Hospitality Net, Hotel performance insights: benchmarking and trends from the Mews Data Snap 2024, November 2024, thousands of properties in more than 85 countries (vendor)
- Mews, New Mews Kiosk cuts check-in time by a third and generates thousands in extra hotel revenue, November 2023 (vendor press release)
- NerdWallet, How to avoid hotel resort fees (and which brands are the worst), updated October 2026, 160 hotels worldwide (editorial)
- Oracle Hospitality with Skift, Travelers want high-tech, low-touch hotel stays shows new Oracle survey, June 2022, 5,266 consumers in nine countries (vendor, seminal; first read on the Stock Titan republication, then confirmed on Oracle's page)
- SiteMinder, Hotel Booking Trends, 2026 (page undated), over 140 million reservations in 20 destinations (vendor)
- SiteMinder, Changing Traveller Report 2025, November 2024, more than 12,000 travelers in 14 markets (vendor)