ResortConcierge AI Research · No. 03
The Resort Staffing Math
Paying more for fewer hours, and where the hours go

On this page
- 01About this report
- 02Key findings: eight numbers for next year's labor budget
- 03Resorts carry one of the heaviest labor loads in lodging
- 04Hotels pay more for fewer hours, and get about the same work
- 05Every departure costs more than the hiring bill shows
- 06We found no measure of where front desk hours go
- 07The seasonal pipeline runs on returning workers and beds
- 08The 2027 labor plan for a 40 to 400 room resort
- 09Test your own property: the seven-day desk tally
- 10What operators are saying
- 11How we built this report
- 12About ResortConcierge AI
- 13Sources
About this report
Labor is more than half of what a US hotel spends to run its operating departments (CBRE, 2025 data). At a resort it also moves with the calendar. The Resort Staffing Math asks two budget questions: what that labor now buys for what it costs, and where the hours actually go.
It is written for general managers (GMs) and owners of independent resorts with 40 to 400 rooms, and for the department heads who turn a labor budget into a weekly schedule.
It is built from published evidence: federal labor and visa statistics, hotel benchmarks, association surveys, academic turnover studies and one resort valley's housing study. Each figure was taken from a source page that was opened and read, and then checked again in a separate pass by a checker who had no hand in writing the report. Where a figure was read in a republication rather than the original, the text or the Sources list says so ("via ..."). Vendor data is labeled as vendor data, and HotStats, a benchmark owned by revenue management software company Duetto, is labeled "benchmark (Duetto)". Studies older than four years carry their year. Where we worked out a percentage change from government figures, we say so each time. Where the evidence is thin, we say that too.
Inside are eight numbers for next year's budget, six chapters ending in a 2027 labor plan, a seven-day front desk tally and turnover cost worksheet you can run with a simple sheet, and the full method and source list. The designed report, with the tally layout and the printable worksheet, is free to download.
Key findings: eight numbers for next year's labor budget
Hotels now pay far more for each hour of work than they did in 2019, and they get about the same work for it. Hospitality workers still quit at twice the national rate, each departure costs more than the hiring bill shows, and the seasonal pipeline is capped by visas and beds. Hiring alone will not close that gap. The 2027 plan has to decide where each labor hour goes.
22.1%
Rise in compensation at the typical US hotel from 2019 to 2024, while hours worked fell 7.4%.
CBRE Hotels Research, May 2025 (preliminary sample of 2,600 US hotels)
About 30%
Rise in unit labor costs in US traveler accommodation from 2019 to 2025: the labor cost of producing the same unit of output. Output per hour rose only about 2.5%.
US Bureau of Labor Statistics (BLS), productivity by industry (our calculation from BLS data)
$16.86
Median hourly wage of US hotel, motel and resort desk clerks in May 2025, against $11.76 in May 2019. BLS cautions against comparing these surveys across years.
BLS Occupational Employment and Wage Statistics, May 2025 (261,420 employed) and May 2019
4.2 vs 2.0
Average monthly quits per 100 workers in accommodation and food services in 2025, against all industries. By August 2026 the sector's seasonally adjusted monthly rate was 3.5, below every month of 2019.
BLS Job Openings and Labor Turnover Survey (includes restaurants; August 2026 preliminary)
$0.75
For each $1 of added US hotel revenue in 2024, costs rose $1.04, and $0.75 of that was labor.
HotStats via Hospitality Net, April 2025, 2024 US hotels (benchmark (Duetto); sample not stated)
54 to 80 workdays
How long a new front office associate took to reach acceptable competence in a 2000 Cornell study. Lost productivity was over half of each departure's cost.
Hinkin and Tracey, Cornell, 2000 (four full-service hotels; seminal)
162,603
H-2B seasonal worker positions requested for April 1, 2026 starts, against a half-year visa cap of 33,000.
US Departments of Homeland Security and Labor, February 2026
400
Potential hires who turned down jobs in Colorado's Gunnison Valley in the past 12 months because they could not find housing. Rental vacancy was under 1%.
2024 Gunnison Valley Housing Needs Assessment (134 employers; one resort area)
None of these figures isolate independent resorts with 40 to 400 rooms. The turnover and wage growth series include restaurants, the turnover cost studies date from 2000 and 2006, and the visa and housing figures describe programs and places rather than any one property. Read them as the clearest view we found, not a census.
The full report
The Resort Staffing Math
Resorts carry one of the heaviest labor loads in lodging
In the one published ranking we found, resorts need more labor for each occupied room than the other three hotel types it covers, and they need it unevenly through the year. The benchmarks behind that claim are thinner than the problem: one vendor's ranking and an independent study built on 2013 data.
One vendor's ranking. HotelData.com and Actabl, a hotel labor software company, put resorts at 4.48 labor hours per occupied room, against 2.57 at full service hotels, 1.44 at select service and 1.30 at extended stay (December 2025, vendor data). The figures come from hotels that use the vendor's software. The report covers January to September 2025 but does not say which period these figures use, how many resorts are included or what counts as a resort, and a later report from the same vendor disagrees on how 2025 hours moved. Read 4.48 as a ranking, not a target.
The last independent split. The most recent independent figure we found that separates resorts is more than a decade old. In 2013 data, CBRE found labor took roughly 35% of total revenue at convention and resort hotels, against 22% at limited service and extended stay properties (published 2014). In a study of 2019 and 2020 data from 3,254 hotels, CBRE found that full service, convention, all-suite and resort hotels needed the most employees per room (published 2021). Across all hotel types, labor took 32.4% of revenue in 2023 (CBRE, 2,456 hotels).
A recent ratio to check against. HotStats, a hotel benchmark owned by Duetto, a revenue management software company (LODGING, April 2025), put the labor cost ratio at 33.5% for non-union US hotels and 43.0% for union hotels in the first eight months of 2025 (benchmark (Duetto); HotStats via Hospitality Net, December 2025, contributed by HotStats and Duetto; sample not stated). It is not resort-specific, but it gives an owner a recent line to check against.
Good news with pressure attached. In CBRE's sample of 2,216 hotels, only resort and all-suite hotels grew profit in 2025 (published May 2026). That gives resort owners room to invest in their people, and more to lose when hours go to the wrong work.
The seasonal swing. Resort labor also moves with the calendar. In the Gunnison Valley, more than 8% of jobs went unfilled in the winter of 2023 to 2024 (2024 Gunnison Valley Housing Needs Assessment). The seasonal pipeline chapter below follows it in detail.
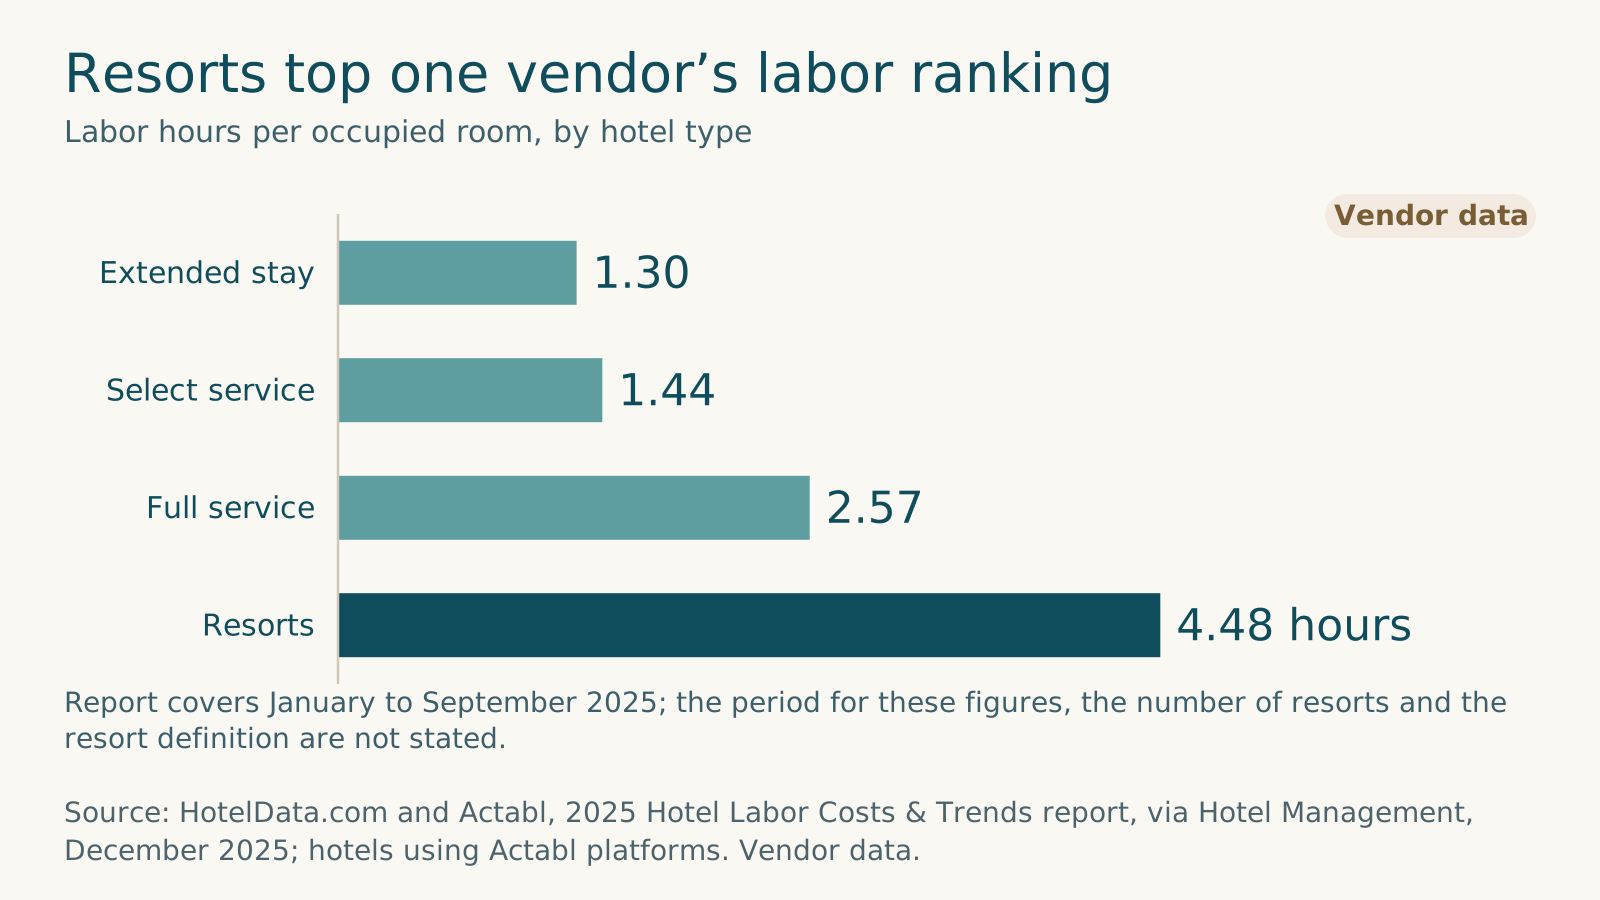
Figure 1. Resorts top one vendor’s labor ranking. Source: HotelData.com and Actabl, 2025 Hotel Labor Costs & Trends report, via Hotel Management, December 2025; hotels using Actabl platforms. Vendor data.
Hotels pay more for fewer hours, and get about the same work
Since 2019, US hotels have cut hours and paid much more for the hours that remain. An industry benchmark and the government's productivity data agree on how far hours fell; on pay, the benchmark's rise runs ahead of the government's over the same years. The government data adds the hard part: output per hour has barely moved, so the extra pay bought the same work, not more of it.
The industry benchmark. In CBRE's preliminary sample of 2,600 US hotels, "the number of hours worked at the typical hotel in our sample is down 7.4% since 2019," while "the dollars paid for compensation are up 22.1%" (May 2025, covering 2019 to 2024). CBRE derives those hours from cost data and government hourly pay figures rather than counting them. An earlier edition found the average hotel ran with 5.9% fewer employees in 2023 than in 2019 (CBRE, June 2024, 2,456 hotels).
The government view. BLS measures hours, pay and output for traveler accommodation: hotels, motels, casino hotels and bed and breakfasts. From 2019 to 2025, by our calculation from BLS data:
- Hours worked fell about 8%, from 3,075 million to 2,816 million.
- Labor compensation rose about 22%, before inflation.
- Real output fell about 6%.
- Output per hour rose only about 2.5%.
- Unit labor costs, the labor cost of producing the same unit of output, rose about 30%.
The two sources were built differently. Over the same 2019 to 2024 years they agree on hours: down 7.4% in CBRE's sample and about 8% in the BLS series. They differ on pay: CBRE's compensation rose 22.1%, while the BLS series rose about 16% through 2024 and reached about 22% only in 2025 (our calculation from BLS data). The BLS series adds what the money bought: about the same output per hour as in 2019.
The desk clerk raise. In May 2025, the 261,420 hotel, motel and resort desk clerks in the US earned a median of $16.86 an hour and a mean of $17.09 (BLS Occupational Employment and Wage Statistics). In May 2019 the median was $11.76. By our calculation from BLS data, that is a rise of about 43%, against about 28% for the median across all occupations. BLS cautions against comparing these surveys across years, so read the change as direction and rough size.
Wage growth is cooling. Wages and salaries in accommodation and food services rose 2.3% in the 12 months to June 2026, against 3.1% for all private industry (BLS Employment Cost Index). A year earlier the sector was rising at 3.1%. These figures include restaurants; BLS does not publish the index for accommodation alone.
Revenue is the new squeeze. With raises slowing, the pressure comes from the top line. In 2025, hotel labor costs per occupied room rose 2.9% while total operating revenue rose 2.6% and rooms revenue just 1.1% (CBRE, 2,216 hotels). Labor costs per occupied room rose more slowly than leisure and hospitality wage rates, up 4.2%. The two figures measure different things, but the gap may mean operators absorbed part of the raise through scheduling. The year before was harder: each extra dollar of US hotel revenue in 2024 came with $1.04 of extra cost, and $0.75 of that was labor (HotStats, benchmark (Duetto), April 2025, sample not stated). In a survey fielded in late February 2026, 65% of hoteliers named labor costs as a financial pressure, second only to the cost of goods and supplies at 71% (American Hotel & Lodging Association (AHLA), March 2026, 246 hoteliers).
For a 2027 budget, the big wage reset has largely happened and is slowing. What is still open is how many hours a resort buys and what it asks those hours to do.
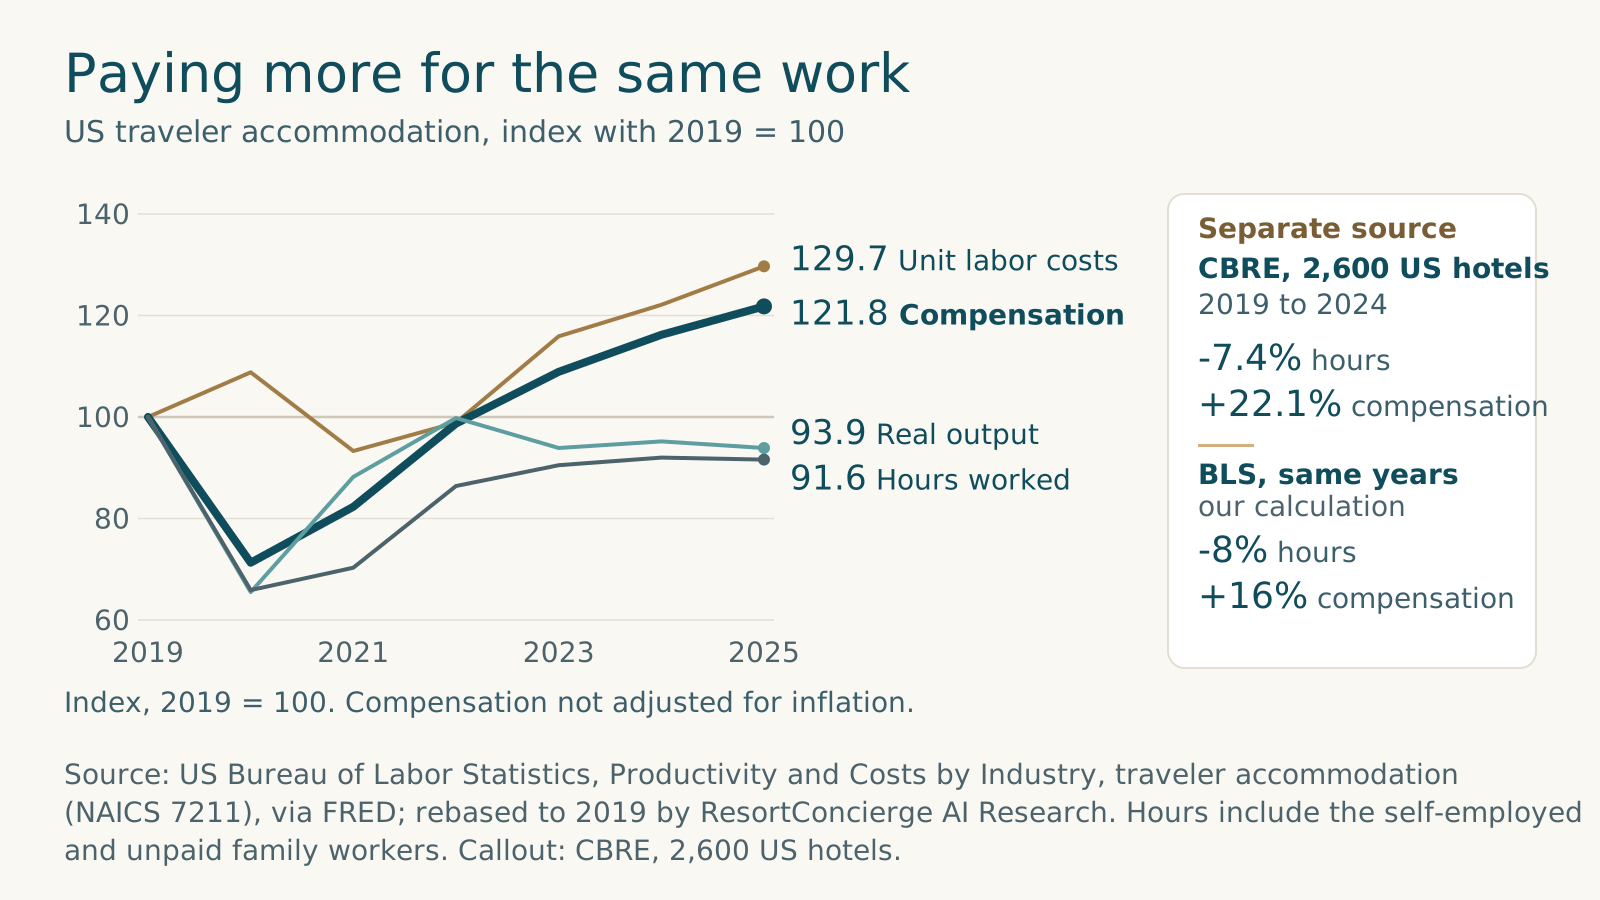
Figure 2. Paying more for the same work. Source: US Bureau of Labor Statistics, Productivity and Costs by Industry, traveler accommodation (NAICS 7211), via FRED; rebased to 2019 by ResortConcierge AI Research. Hours include the self-employed and unpaid family workers. Callout: CBRE, 2,600 US hotels.
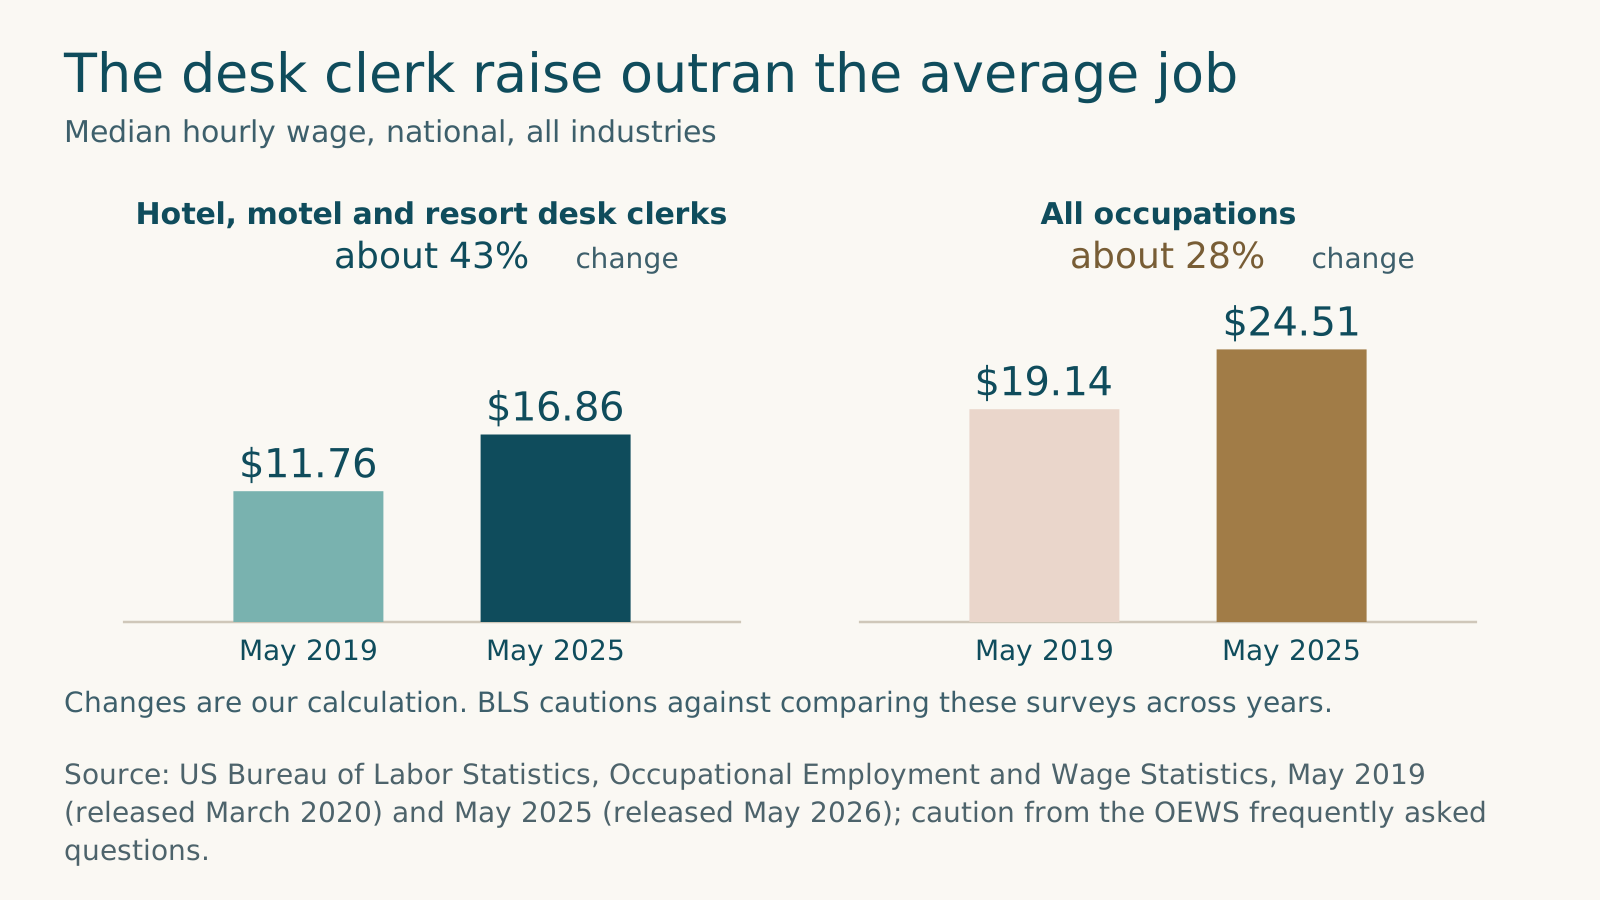
Figure 3. The desk clerk raise outran the average job. Source: US Bureau of Labor Statistics, Occupational Employment and Wage Statistics, May 2019 (released March 2020) and May 2025 (released May 2026); caution from the OEWS frequently asked questions.
Every departure costs more than the hiring bill shows
Workers in accommodation and food services still quit at about twice the rate of the wider economy. Most of the cost of each departure never appears on an invoice: it sits in the weeks a new hire spends learning the job and in the coworkers who cover for them. Quits are now cooling, which makes 2027 a year to keep people rather than replace them.
Running to stand still. In 2025, accommodation and food services hired 5.5 workers per 100 each month and lost 5.5 (BLS Job Openings and Labor Turnover Survey, or JOLTS). Quits alone ran at 4.2 per 100 a month, against 2.0 across all industries. These rates include restaurants and bars, because BLS publishes no turnover rate for accommodation alone; treat any "hotel turnover rate" credited to BLS as unverified. They are also average monthly rates, which do not multiply cleanly into annual turnover.
Hiring alone did not fix it. In May 2024, 86% of hoteliers said they had raised wages in the previous six months, and 76% still reported a staffing shortage (AHLA, 456 hoteliers). In a survey fielded in December 2024 and January 2025, 65% reported shortages, and front desk was the second most mentioned shortage, at 26%, after housekeeping at 38% (AHLA with its vendor partner Hireology, 282 hoteliers).
The window is opening. The seasonally adjusted quits rate in the sector fell to 3.5 in August 2026 (preliminary), below every month of 2019 (4.5 to 5.1) and far from the peak of 6.3 in November 2021 and March 2022 (BLS JOLTS via FRED). Job openings were 713,000 in August 2026, down from 942,000 a year earlier (BLS, preliminary; includes restaurants). Fewer people are quitting and fewer jobs are open, which shifts the math toward keeping the people already trained.
What one front desk departure costs. The only study we found that prices a front desk departure line by line was published in 2000. Cornell researchers Hinkin and Tracey priced the departure of one front office associate at four full-service hotels, two in Miami and two in New York, at $5,688, $5,965, $11,609 and $12,882 (2000 dollars). The average came to "nearly one-third of the position's annual salary." Of their five cost categories (separation, recruitment, selection, hiring and lost productivity), lost productivity was over half the total in every hotel, from 55% to 69%.
The learning curve explains the size. Managers and employees estimated that a new front office associate started at 50% to 65% of a competent colleague's proficiency and took 54 to 80 workdays to reach an acceptable level, while coworkers lost 15% to 50% of their own productivity helping. These are 26-year-old interview estimates, and still the only published time-to-competence figures for the front desk that we found.
The 2006 follow-up. Tracey and Hinkin's 2006 report for Cornell's Center for Hospitality Research studied 33 US properties, about half of them independent, averaging about 180 rooms, with data on 28 line-level jobs in rooms and food and beverage. It is the sample closest to this report's reader. A departure cost $5,694 on average for lower-complexity jobs and $9,932 for higher-complexity jobs (dollars as reported; the report does not state the data year), and lost productivity was again the largest share, at 55.2% and 67.6%. Costs ran higher at properties with 108 rooms or more ($9,247, against $4,821 below that) and at upscale properties. Independents came in slightly above chains, $7,612 against $6,957, a difference the authors found not statistically significant. The sample was small and self-selected, and these figures are read from a third-party copy of the report.
Two practices were linked with lower costs: spending a larger share on exit interviews, and involving supervisors and peers more in selection (Cornell, December 2006).
A wider cross-check. Reviewing 30 case studies, the Center for American Progress found that for jobs paying under $30,000 a year, the typical cost of turnover was 16% of annual salary (2012; pooled studies, most on one occupation in one industry, not hospitality-specific). The old dollar figures do not carry over to 2027; the cost shares and workdays do, which is why the test section's worksheet uses Cornell's categories with your own wages.
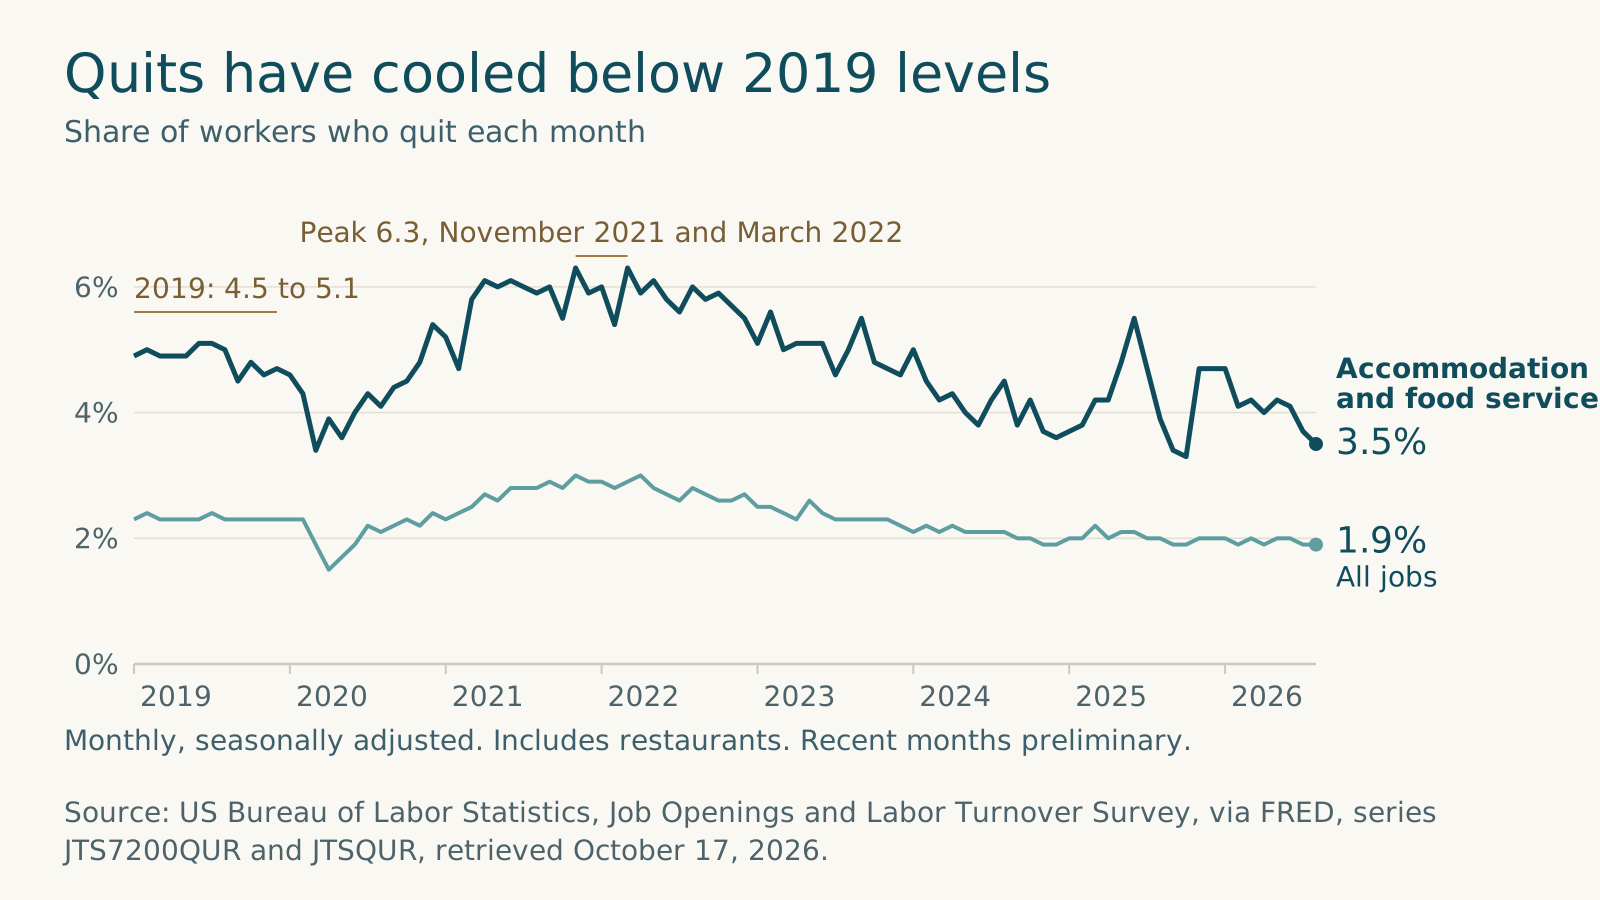
Figure 4. Quits have cooled below 2019 levels. Source: US Bureau of Labor Statistics, Job Openings and Labor Turnover Survey, via FRED, series JTS7200QUR and JTSQUR, retrieved October 17, 2026.
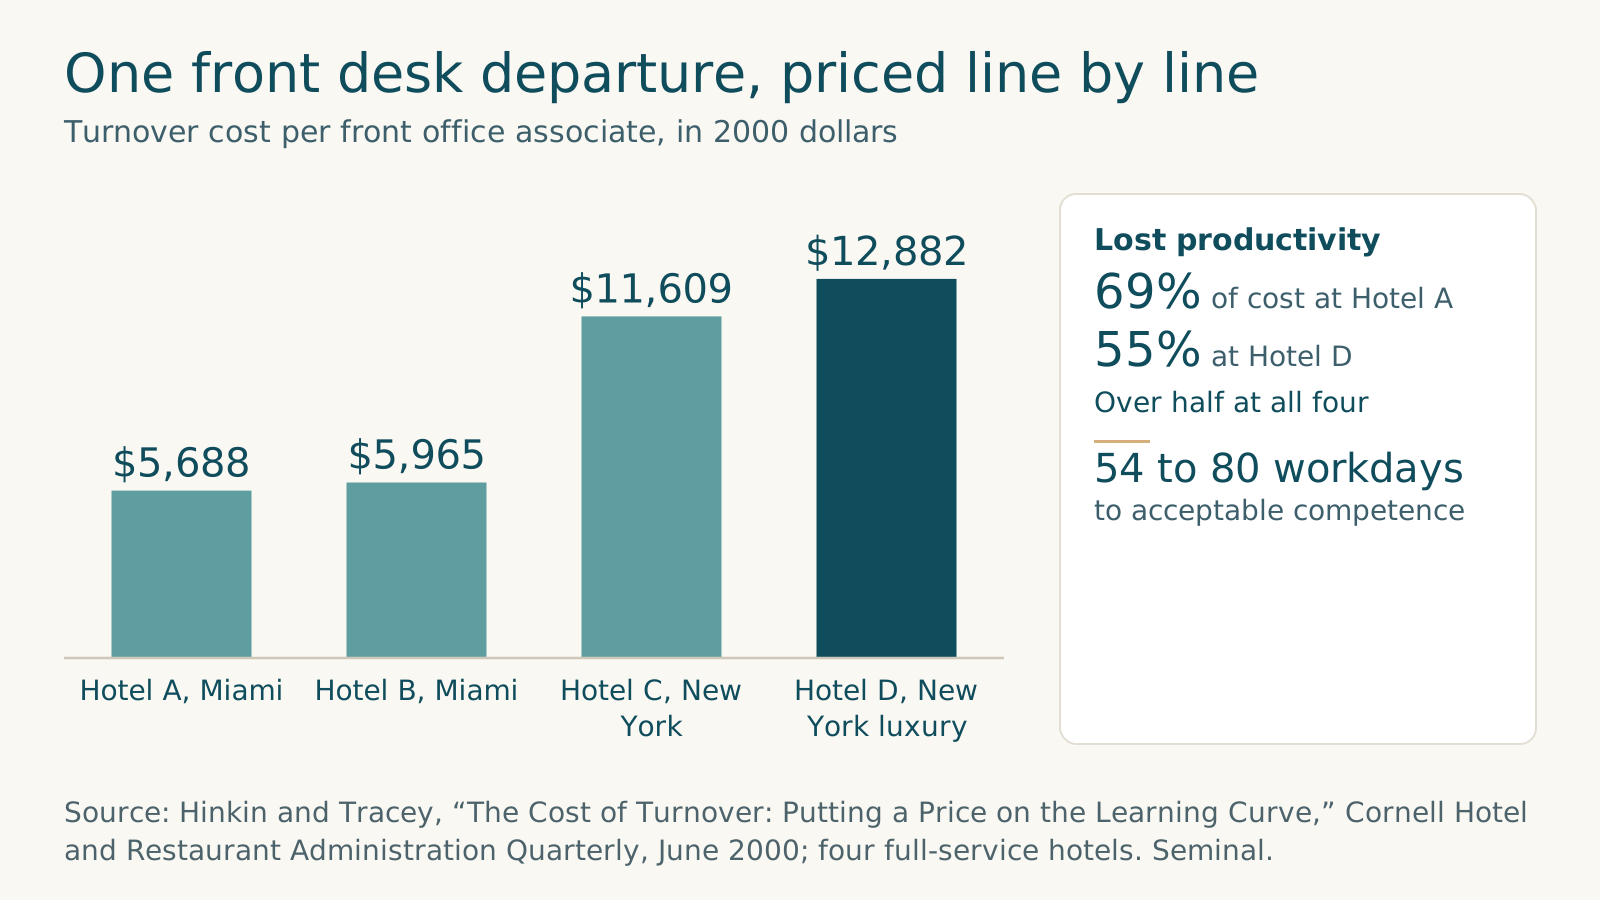
Figure 5. One front desk departure, priced line by line. Source: Hinkin and Tracey, “The Cost of Turnover: Putting a Price on the Learning Curve,” Cornell Hotel and Restaurant Administration Quarterly, June 2000; four full-service hotels. Seminal.
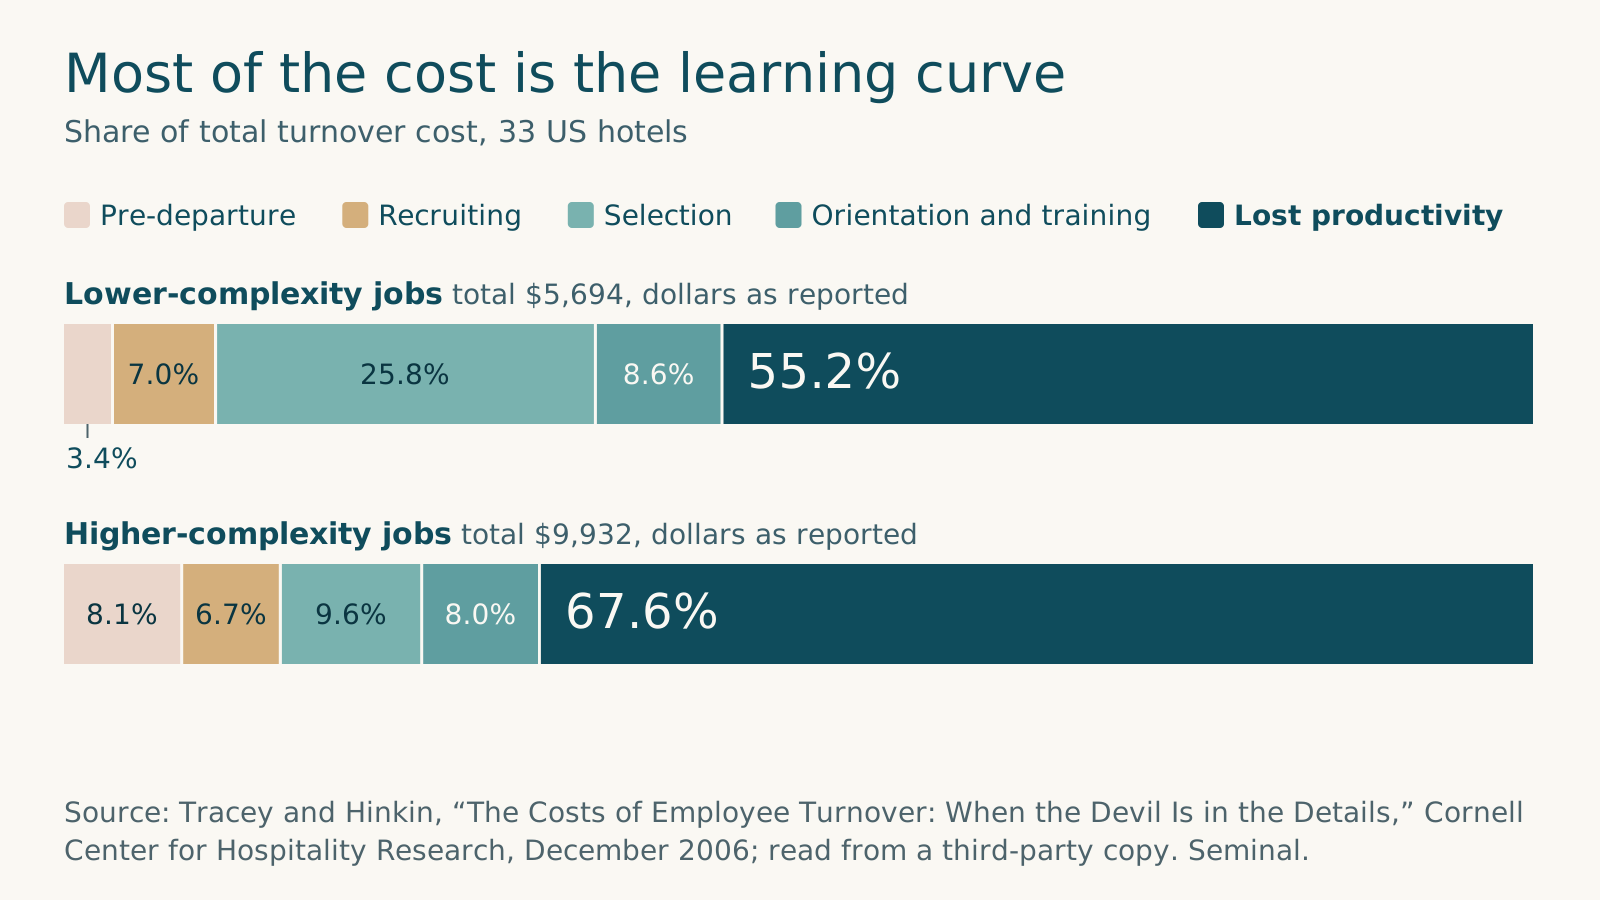
Figure 6. Most of the cost is the learning curve. Source: Tracey and Hinkin, “The Costs of Employee Turnover: When the Devil Is in the Details,” Cornell Center for Hospitality Research, December 2006; read from a third-party copy. Seminal.
We found no measure of where front desk hours go
We found no independent study that measures how front desk time is spent. The vendor data we found suggests a real share of guest contact repeats what the property already told the guest, but the best of it comes from short-term rentals, not resorts. A resort that wants the answer has to count.
What the government records. The Department of Labor's ONET profile for hotel, motel and resort desk clerks reports that 97% have telephone conversations every day and 57% handle email every day. On a 100 point importance scale, making and confirming reservations scores 96, as does greeting, registering and assigning rooms; answering questions about services and directions scores 75 (ONET, 2026 profile). That shows how often and how important, not where the minutes go.
What one vendor measured in messages. Conduit, a guest messaging vendor, analyzed about 10 million inbound guest messages across 68,625 short-term rental properties in 78 countries, from August 2025 to July 2026. By matching questions to earlier messages in the same thread, it found that 27.4% of guests who asked for a door code had already been sent it. For check-in time the figure was 20.8%, and for the Wi-Fi password 18.4%. Conduit calls these rates a floor, because answers sent in links, PDFs or property management system templates are not captured. Five topics, led by arrival and departure logistics, made up 54% of a sample of about 70,000 messages (Conduit, August 2026, vendor). These are short-term rentals, not resorts, but it is the only published measure we found of "already answered" with a stated method, and any property can copy the method.
What one vendor heard on the phone. HelloShift, which sells an AI voice agent to hotels, reports that about a quarter of inbound calls to hotels on its platform arrived outside 8am to 6pm. Of engaged calls in a hand-reviewed sample, with hang-ups excluded, about 27% wanted to reach a person and about 19% were in-stay requests (HelloShift via Hotel Tech Report, June 2026, vendor). The company does not disclose how many calls sit behind these shares, so treat them as a guide, not a benchmark.
What properties have already cut. In a 2023 Deloitte survey of 120 hotel GMs, 70% had reduced or eliminated amenities or services because of staffing shortfalls, and 43% were automating repetitive tasks. The next cut should rest on evidence from the property's own desk.
Why counting matters now. Hours in US lodging are down about 8% since 2019 (our calculation from BLS data), and each remaining hour costs more. A desk hour spent re-sending a Wi-Fi password is an hour not spent on a booking call. A seven-day tally coded by topic, channel and hour is the cheapest way to find those hours.
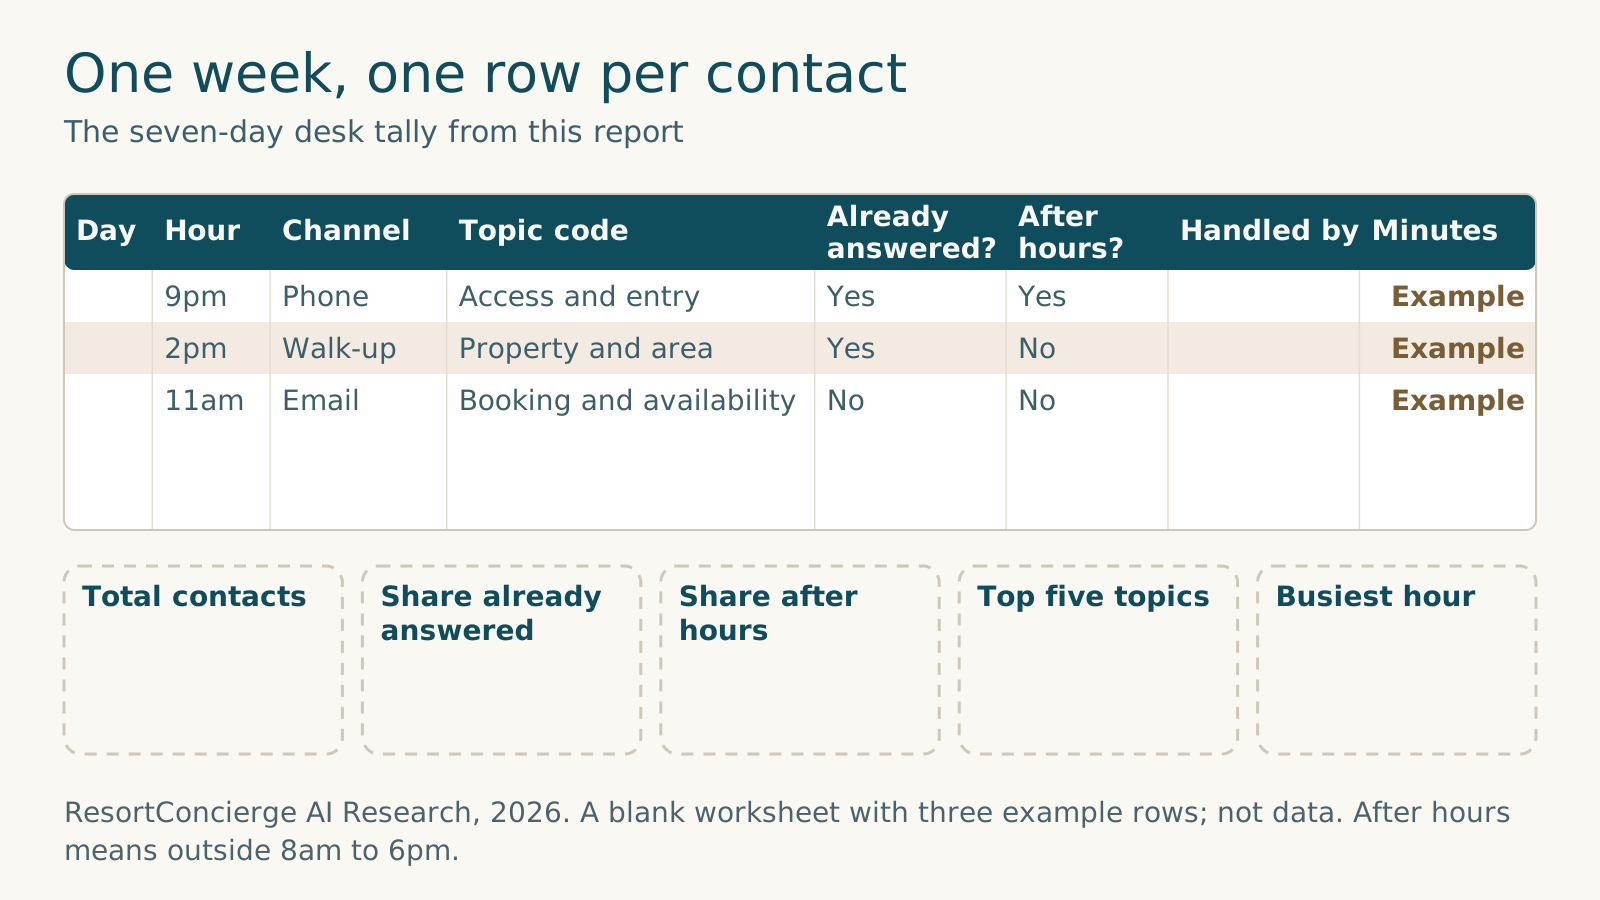
Figure 7. One week, one row per contact. ResortConcierge AI Research, 2026. A blank worksheet with three example rows; not data. After hours means outside 8am to 6pm.
The seasonal pipeline runs on returning workers and beds
For resorts that rely on seasonal visas, demand runs far beyond supply, and the rules now favor people who have come before. Housing limits the rest. For a summer season, a plan that starts recruiting in spring is already late. This is general information, not legal advice; work with immigration counsel on any filing.
H-2B demand. The H-2B visa covers temporary non-agricultural work, with a statutory cap of 66,000 visas a year, 33,000 for each half of the fiscal year (FY). For April 1, 2026 starts, employers requested 162,603 worker positions (US Department of Labor (DOL), January 2026), up from 149,953 a year earlier (US Department of Homeland Security (DHS) and DOL rule, February 2026). For October 1 starts, requests rose from 44,238 positions in 2024 to 47,488 in 2025 and 51,158 in 2026 (DHS and DOL rule; DOL, July 2026). The first-half FY2026 cap was reached on September 12, 2025 (DHS and DOL rule; US Citizenship and Immigration Services (USCIS) alert of September 16, 2025, via the American Immigration Lawyers Association (AILA)). Positions requested are not visas; one worker can appear on more than one request. Lodging is a real slice of the demand: in FY2025, maids and housekeeping cleaners were the second largest H-2B occupation, with 15,727 positions certified (DOL Office of Foreign Labor Certification).
The rules favor returning workers. For FY2026, DHS and DOL made up to 64,716 supplemental visas available and limited 46,226 of them to returning workers, meaning people issued an H-2B visa or granted H-2B status in FY2023, 2024 or 2025 (DHS and DOL rule, February 2026). The first returning worker allocation reached its cap, with February 6, 2026 the final receipt date for petitions (USCIS alert of February 13, 2026, via AILA; Miller Mayer, March 2026). The USCIS alert for the first half of FY2027 did not load for this report, so that date rests on a law firm summary: September 4, 2026 was the final receipt date for new cap-subject petitions for work starting before April 1, 2027 (EIG Law, September 2026).
One resort town's reliance. In Bar Harbor, Maine, four of the top five local H-2B beneficiaries were hotels, led by Witham Family Hotels with 477. Across Hancock County, leisure and hospitality jobs rose from 5,976 in July 2015 to 7,429 in July 2025 while the civilian workforce fell from 32,105 to 31,390 (The Ellsworth American, May 2026; the approval year and employment series are not stated).
J-1 Summer Work Travel. The program brings international students to work in the US for up to four months (US State Department). Participation fell about 2%, from 107,228 in 2024 to 104,609 in 2025, according to the Alliance for International Exchange, an association of exchange sponsors, reading State Department figures; the State Department file itself did not load for this report. For summer 2026 the Alliance estimated that 19,400 expected participants, 23% of the total, were at risk of not getting a visa interview in time (May 2026, advocacy estimate). Sponsors must also "consider the availability of suitable, affordable housing" (US State Department).
Housing is the hard limit. Colorado's Gunnison Valley, home to Crested Butte, shows the constraint when someone counts it. In a March 2024 survey of 134 employers representing 5,017 jobs, over 70% said they had problems keeping or hiring employees because of the lack of housing. In the past 12 months, about 400 potential hires turned down jobs for lack of housing, and 240 employees left because of it. Rental vacancy was under 1%, and 47% of employers said they would consider building or buying units to rent to staff (2024 Gunnison Valley Housing Needs Assessment). This is one resort area, and the survey covers all employers. It is an example, not a national figure.
Large ski resorts have answered by building: Winter Park Resort completed 330 units of workforce housing, at about $60 million, in December 2023 (Mile High CRE, February 2024). The comparison behind it, beds against hires, works at any size.
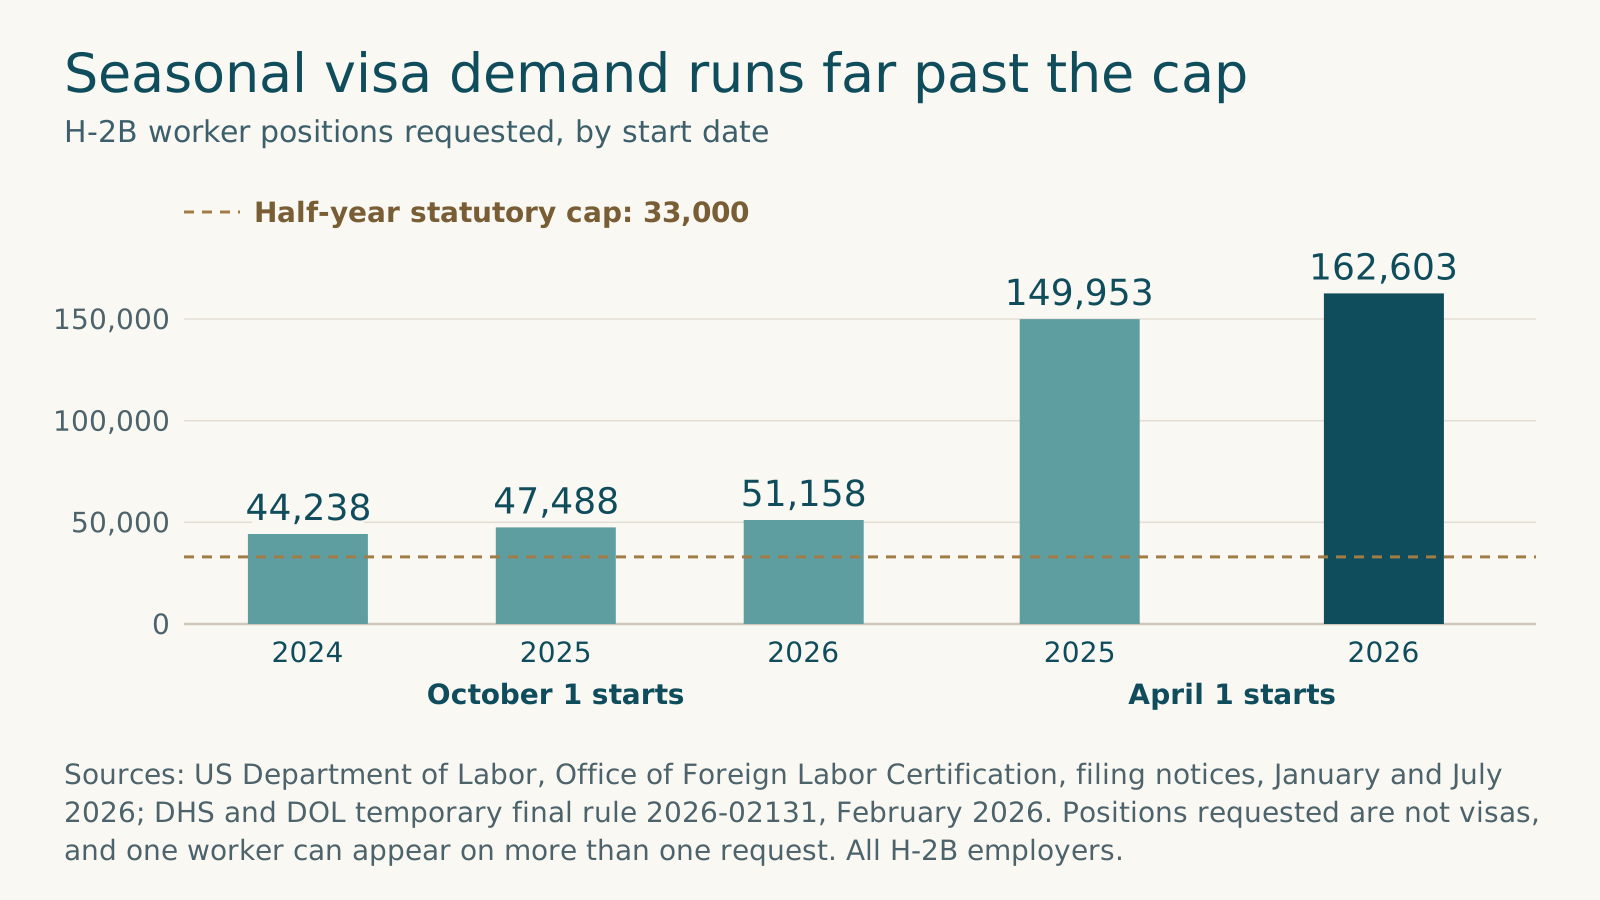
Figure 8. Seasonal visa demand runs far past the cap. Sources: US Department of Labor, Office of Foreign Labor Certification, filing notices, January and July 2026; DHS and DOL temporary final rule 2026-02131, February 2026. Positions requested are not visas, and one worker can appear on more than one request. All H-2B employers.
Four rules for the seasonal pipeline
- Build next year's crew list before this season ends. Record each seasonal worker's role, dates, visa history and whether they want to return. Most FY2026 supplemental H-2B visas were limited to returning workers.
- Work back from the filing windows, not the opening date. In the last cycle, the H-2B window for April 1 starts ran January 1 to 3, 2026, and for October 1 starts July 3 to 5, 2026 (DOL). Confirm 2027 dates against the DOL and USCIS notices with counsel, and have paperwork ready before the window opens.
- Count beds before you make offers. Set hiring targets against the beds you control or can book, not against the jobs you need filled.
- Do not let one program carry the season. Keep a year-round and domestic core large enough to open the property if a visa program comes up short.
The 2027 labor plan for a 40 to 400 room resort
A 2027 plan should decide where hours go before it decides how many to buy. Each hour costs far more than in 2019, each departure takes weeks of output with it, and the seasonal pipeline is capped by rules and beds.
Measure where desk hours go first. Run the seven-day tally in the next section in a peak week and again in a shoulder week. Watch three numbers: the share of contacts already answered on your website or in your messages, the share after hours, and the top five topics by hour. Set them beside your own labor hours per occupied room by department.
Stop answering what guests already have. If guests keep asking for check-in times, Wi-Fi passwords, door codes and directions they were already sent, the fix sits upstream of the desk. Send each answer when the guest needs it, put it where guests look first, and let automation answer the repeats.
Automate the routine, not the judgment. Routine questions, especially after hours, can be answered automatically or acknowledged with a clear time for a person to follow up. Anything urgent, emotional or unusual goes to a person quickly, with the context attached. In one vendor's call data, about 27% of engaged calls in a reviewed sample simply wanted a person (HelloShift, 2026, vendor, sample not disclosed), which argues for better routing, not fewer people.
Hire for the hours that need a person. Booking conversations, arrivals and problem stays are where a person earns the hour, and they are the costliest jobs to refill. Bring supervisors and peers into selection; Cornell's 2006 study linked their involvement to lower turnover costs.
Protect the people who already know the job. With quits below 2019 levels, 2027 is a year to hold on to people. In AHLA's survey published in March 2026, 70% of hoteliers were offering higher wages to recruit and retain staff, 54% flexible scheduling, 54% hotel discounts and 31% enhanced benefits (246 hoteliers). Ask every seasonal worker about next year before they leave, and offer a rehire date and a bed.
Lock in housing and visa timing. Build the hiring calendar back from the filing windows and the bed count: crew list, filing window, beds, then offers.
Put turnover in the budget as a line. Price one front desk departure with the worksheet in the test section, then multiply by the departures you expect. Lost productivity was over half the cost in every hotel Cornell studied in 2000, so time to competence is the line most worth managing: a written training plan, a named buddy on shift and a weekly check until supervisors agree the new hire is ready.
The 2027 plan on one page
| Decision | What to do in 2027 | Evidence behind it |
|---|---|---|
| Stop | Re-answering what guests already have: check-in time, Wi-Fi, codes, parking, directions | 27.4% of short-term rental guests asking for a door code had already been sent it (Conduit, 2026, vendor) |
| Automate | Routine questions after hours, with urgent issues routed to a person | About a quarter of calls arrive outside 8am to 6pm (HelloShift, 2026, vendor, sample not disclosed) |
| Hire for | Booking, arrival and problem-solving roles, with supervisors and peers in selection | Higher-complexity departures cost $9,932 against $5,694 (Cornell, 2006, dollars as reported) |
| Protect | Returning seasonal staff and the year-round core | 46,226 of 64,716 FY2026 supplemental H-2B visas limited to returning workers (DHS and DOL) |
| House | Beds counted and booked before offers go out | About 400 potential hires declined jobs for lack of housing (Gunnison Valley, 2024) |
| File | Visa paperwork timed to the filing windows | 162,603 positions requested in the January 2026 window for April 1 starts (DOL) |
| Measure | A seven-day desk tally each peak and shoulder season, plus turnover cost per departure | We found no independent time study of front desk work |
Review the plan after the first peak week of 2027, with a fresh tally in hand.
Self-check
How well do you know your labor math?
Seven quick questions drawn from the desk tally and worksheet in this report. It takes about a minute, and nothing you enter is saved.
- Do you know how many guest contacts your front desk handles in a week, by channel?
- Do your top five guest questions have current answers on your website and in your pre-arrival message?
- Does every contact outside 8am to 6pm have a named owner or a clear next step?
- When did you last set desk pay against the market?
- Do you know what one front desk departure costs you?
- Do you know how long a new desk hire takes to reach acceptable competence?
- Before last season ended, did you ask your seasonal staff about coming back?
Test your own property: the seven-day desk tally
You can see where your front desk hours go with a shared spreadsheet or a printed sheet and one week, then price one departure with what you already know about your team. Both follow the methods behind this report's published figures, so your results can sit next to them.
Before you start. Tell the team the point: to find hours to give back, not to grade anyone. Pick a busy week and plan to repeat it in a shoulder week. Mark "after hours" as anything outside 8am to 6pm, the window HelloShift's call data used. Keep guest names off the sheet.
1. Set up one row per contact. Columns: day, hour, channel, topic code, already answered (yes or no), after hours (yes or no), who handled it, and minutes if you can track them. Figure 7 shows the layout.
2. Code every contact by topic. Use the same codes all week, borrowed from the categories two vendors used for their own data: arrival and departure; access and entry (keys, codes, Wi-Fi); booking and availability; existing reservation; property and area (amenities, hours, pets, parking, directions); in-stay request; problem or complaint; billing; reaching a specific person; other.
3. Count every channel for seven days. Phone, text and WhatsApp, email, website chat, online travel agency (OTA) messages and walk-ups, overnight included. Walk-ups get a clipboard tick with the hour and topic.
4. Mark what was already answered. For each contact, ask: could the guest have found this on our website, in the confirmation email or in a pre-arrival message? Mark yes only if the answer was there and current.
5. Add it up. Count total contacts, the share by channel and the top five topics. Chart contacts by hour against your desk schedule. Work out the share already answered and the share after hours, and how many after-hours contacts were urgent.
6. Price one front desk departure. Take the most recent person who left the desk and work through Cornell's five cost categories, pricing staff time as hours times hourly pay plus direct costs, as Cornell's 2006 tool did.
- Pre-departure. Exit interview, paperwork, final pay.
- Recruiting. Advertising, referral bonuses, screening hours.
- Selection. Interviews, checks and every interviewer's time.
- Orientation and training. Trainer and trainee hours, materials, uniform.
- Lost productivity. Ask two supervisors Cornell's two questions from 2000: on a scale of 1 to 100, how proficient is a new hire compared with someone who is competent, and how many workdays until they reach an acceptable level? Our simplification, not Cornell's: assuming steady improvement, the average shortfall is about half the starting gap. Multiply it by the workdays to competence and a day's pay, then add the hours peers and supervisors spend covering.
The printable worksheet in the PDF sets each check beside its published benchmark, with a box to tick.
Run the tally again in your shoulder season. The difference between the two weeks shows where your schedule should flex.
The full report
The Resort Staffing Math
What operators are saying
The clearest public voices on seasonal staffing come from resort towns and ski resorts, where housing often decides who can take the job. None of these quotes come from vendor case studies.
Deer Valley Resort, Utah (ski resort). Chris Lampe, director of human resources, in 2019, when the resort had 415 beds for nearly 2,300 winter hires: "We certainly have more interest than we're able to fulfill, as far as number of beds, and it depends year to year." Source: KPCW, September 2019. Editorial.
Winter Park Resort, Colorado (ski resort). Sky Foulkes, president, on opening 330 units of workforce housing: "we wanted to make sure our seasonal and year-round workers have affordable housing ..." Source: Mile High CRE, February 2024. Editorial; excerpt.
Acadia National Park, Maine (a public employer in the Bar Harbor labor market, not a hotel). Kevin Schneider, superintendent: "we were not able to fill all of our available seasonal positions largely because of the lack of housing options ..." Source: Bar Harbor Story, June 2025, reporting credited to the Bangor Daily News. Editorial; excerpt.
From a branded hotel: Holiday Inn and Suites Tupelo, Mississippi (run by Wealth Hospitality Group). Redah Cleveland, assistant general manager, on how occupancy shapes the schedule: "With hotel occupancy, your housekeepers may only work 3-4 hours one day and the next work a full 8-hour shift." Source: Northeast Mississippi Daily Journal via Hotel Online, July 2025. Editorial.
In each case the job and the applicant both exist. What fails to line up is the bed, or the shape of the hours.
How we built this report
This edition is a synthesis of published evidence.
What we looked for. Published measurements of what hotel labor costs and produces, how often hospitality workers leave and what a departure costs, how seasonal visa programs and housing limit hiring, and how front desk time is spent. We preferred work published from 2022 to 2026 and kept older studies only where we found nothing newer. Those carry their year.
How we checked it. Each figure was taken from a source page that was opened and read, not from a search result, and then checked again, along with each quote, in a separate pass by a checker who had no hand in writing the report. Where a figure was read in a republication rather than on the original page, the text or its Sources entry says so ("via ..."). Where an official page would not open, we used a named secondary source and say so in the text. We dropped widely repeated claims we could not trace to a primary source, including an annual hotel turnover rate often credited to BLS, which publishes no turnover rate for hotels alone, and a common rule of thumb for the cost of replacing a worker as a share of salary.
How to read it.
- Our calculations are labeled. Changes since 2019 in the BLS productivity series and desk clerk wages are our arithmetic on published BLS values. BLS cautions against comparing its wage surveys across years. Compensation is not adjusted for inflation.
- Restaurants are in the turnover data. JOLTS and the Employment Cost Index report accommodation and food services together; BLS publishes no turnover rate for accommodation alone. JOLTS rates are monthly averages and are not converted to annual rates here.
- Vendor data is labeled. The resort labor hours benchmark comes from a report covering January to September 2025, but it does not say which period the by-type figures use, how many resorts are included or what counts as a resort, and one later report from the same vendor disagrees on 2025 hours. HotStats is labeled "benchmark (Duetto)" because it is owned by Duetto, a revenue management software company. Of the two front desk workload sources, one covers short-term rentals and the other does not disclose its sample.
- The turnover cost studies are old. Cornell's 2000 and 2006 studies remain the only line-by-line pricing of a hotel departure we found. Their dollars are not adjusted; their cost shares and workdays are the useful part.
- Visa figures measure paperwork, not people. Positions requested are not visas.
- Places are examples. The Gunnison Valley and Bar Harbor are single resort areas.
Sponsor. This report is published by ResortConcierge AI, which makes guest communication software for independent resorts. The product appears only in the About section and the closing invitation.
About ResortConcierge AI
Independent resorts lose guests in the gap between a question and an answer, usually when the desk is busiest or empty. ResortConcierge AI is an AI concierge built for those properties: it helps answer routine guest questions, routes service requests to the right team and flags unhappy guests early, all in one shared inbox, so staff can spend their time on the guests in front of them.
Want to know where your desk hours go?
Run the seven-day tally from this report, then walk through what it shows with us in a private, free 20-minute review of your front desk hours.
Get the next report first
ResortConcierge AI Research publishes on the operating questions independent resorts ask most. One email when each report is out.
More from the series
Frequently asked questions
How many labor hours does a resort use per occupied room?
One vendor benchmark puts resorts at 4.48 labor hours per occupied room, against 2.57 for full service, 1.44 for select service and 1.30 for extended stay (HotelData.com and Actabl, December 2025). The report covers January to September 2025 but does not state the period for these figures, the number of resorts or how it defines a resort.
How have hotel labor costs changed since 2019?
From 2019 to 2025, by our calculation from BLS data, hours worked in US traveler accommodation fell about 8%, labor compensation rose about 22% before inflation, real output fell about 6% and unit labor costs rose about 30%. In CBRE’s sample of 2,600 US hotels, compensation rose 22.1% from 2019 to 2024 while hours fell 7.4%. Over the same 2019 to 2024 years, the BLS series shows hours down about 8% and compensation up about 16% (our calculation).
What do hotel front desk clerks earn?
The national median for hotel, motel and resort desk clerks was $16.86 an hour in May 2025, against $11.76 in May 2019, a rise of about 43% against about 28% for all occupations (BLS; our calculation). BLS cautions against comparing these surveys across years.
How much does it cost when a front desk employee leaves?
A Cornell study of four full-service hotels put the cost at $5,688 to $12,882 per front office associate in 2000 dollars, and lost productivity was over half of it at all four. New hires took 54 to 80 workdays to reach acceptable competence.
Are hotel quit rates still high?
They have cooled. The monthly quits rate in accommodation and food services was 3.5% in August 2026, below every month of 2019 and well below its 6.3% peak, though still above 1.9% for all jobs (BLS, seasonally adjusted, preliminary; includes restaurants).
How hard is it to get H-2B seasonal workers?
Demand runs far past the cap. Employers requested 162,603 worker positions for April 1, 2026 starts, against a half-year statutory cap of 33,000. Positions requested are not visas, and one worker can appear on more than one request (US Department of Labor).
Is this report based on independent resorts only?
No. None of the figures in this report isolates independent resorts with 40 to 400 rooms. The report uses federal statistics for traveler accommodation, hotel benchmarks, academic turnover studies and labeled vendor data.
Sources
All pages opened October 17 and 18, 2026. Vendor means the publisher sells hospitality or communications technology.
- Alliance for International Exchange, Recently released State Department data shows concerning dip in BridgeUSA participation in 2025, February 2026, all Summer Work Travel participants, from State Department data (association of exchange sponsors)
- Alliance for International Exchange, New J-1 visa appointment availability data signals concern for summer 2026, May 2026, member sponsors representing about 60% of participants (association advocacy estimate)
- American Hotel & Lodging Association (AHLA), 76% of surveyed hotels report staffing shortages, via Hospitality Net, June 2024, 456 hoteliers (association)
- AHLA with Hireology, 65% of surveyed U.S. hotels report staffing shortages, via Hospitality Net, February 2025, 282 hoteliers (association with vendor partner)
- AHLA, Rising cost, staffing challenges persist for hotels as travel demand expected to hold steady, March 2026, Front Desk Feedback survey of 246 hoteliers, fielded late February 2026 (association)
- Bar Harbor Story, No place to live means not many to hire, June 2025, reporting credited to the Bangor Daily News (editorial)
- CBRE, All eyes on operating costs in 2025, May 2025, preliminary sample of 2,600 US hotels (independent research)
- CBRE via Hotel Online, New labor challenges arise in 2023, June 2024, 2,456 hotels (independent research)
- CBRE via LODGING, Examining hotel labor costs, October 2014, 2013 data (independent research, seminal)
- CBRE via LODGING, Staffing shifts, July 2021, 3,254 hotels, 2019 and 2020 data (independent research)
- CBRE via LODGING, Profitability under pressure: how 2025 US hotel performance reshapes valuation underwriting, May 2026, 2,216 hotels (independent research)
- Center for American Progress, There are significant business costs to replacing employees, November 2012, 30 case studies from 11 research papers, not hospitality-specific (policy research)
- Conduit, What guests ask, across 10 million messages, August 2026, about 10 million messages from 68,625 short-term rental properties (vendor)
- Cornell University via Newswise, Study finds hidden costs of hotel employee turnover, December 2006, 33 hotels (academic press release, seminal)
- Deloitte via Hotel Online, Travel leaders embrace automation and tech as workforce challenges continue to weigh on industry, September 2023, 120 hotel GMs (independent research)
- EIG Law, USCIS reaches H-2B cap for first half of fiscal year 2027, September 2026 (law firm summary of a USCIS alert)
- The Ellsworth American, The number of seasonal jobs has outpaced local workforce growth, May 2026, from USCIS and state data (editorial)
- Federal Reserve Bank of St. Louis (FRED), BLS JOLTS quits rates, accommodation and food services, JTS7200QUR and total nonfarm, JTSQUR, updated September 2026 (government data)
- Federal Reserve Bank of St. Louis (FRED), BLS productivity series for traveler accommodation: hours worked, hours index, labor compensation, real output, labor productivity, unit labor costs and employment, 2015 to 2025, last updated June 3, 2026 (hours) and August 31, 2026 (compensation, output, productivity and unit labor costs) (government data)
- HelloShift via Hotel Tech Report, HelloShift releases first-party data on AI voice agent performance across hotel properties, June 2026, sample not disclosed (vendor)
- Hinkin and Tracey, The cost of turnover: putting a price on the learning curve, Cornell Hotel and Restaurant Administration Quarterly, June 2000 (date from the eCommons record), four full-service hotels (academic, seminal)
- HotelData.com and Actabl via Hotel Management, Report: operators improve labor efficiency amid rising wages, softer revenue, December 2025, report covering January to September 2025, "thousands of hotels" using Actabl platforms; period for the by-type figures and number of resorts not stated (vendor)
- HotelData.com and Actabl via LODGING, New report finds US hotel labor costs increased as cost per occupied room rose in 2025, March 2026, nearly 5,000 hotels (vendor)
- HotStats via Hospitality Net, commentary on 2024 US hotel cost flow-through, April 2025, sample not stated (benchmark (Duetto))
- HotStats via Hospitality Net, US hotels face profit pressure as labor costs outpace recovery, December 2025, contributed by HotStats and Duetto, first eight months of 2025, sample not stated (benchmark (Duetto); also the source for HotStats' link to Duetto)
- KPCW, Deer Valley has more than 400 beds for winter seasonal employees, September 2019 (editorial)
- LODGING, Duetto announces acquisition of HotStats, April 2025 (trade press; ownership of HotStats)
- Mile High CRE, Winter Park Resort opens workforce housing to first residents, February 2024 (editorial)
- Miller Mayer, USCIS reaches H-2B cap for second half of FY 2026; filing dates now available for supplemental visa allocations, March 2026 (law firm summary of USCIS alerts)
- Northeast Mississippi Daily Journal via Hotel Online, Vacancies available: hotel industry needing to fill staff openings, July 2025 (editorial)
- O*NET OnLine, US Department of Labor, Hotel, motel, and resort desk clerks, 43-4081.00, 2026 profile (government)
- Town of Crested Butte, 2024 Gunnison Valley Housing Needs Assessment, 2024, 134 employers representing 5,017 jobs (government-commissioned study by Western Spaces, WSW Consulting and Urban Rural Continuum)
- Tracey and Hinkin, The costs of employee turnover: when the devil is in the details, Cornell Center for Hospitality Research Reports, Vol. 6, No. 15, December 2006, 33 US hotels, data year not stated (academic, seminal); figures read from a third-party copy
- US Bureau of Labor Statistics, JOLTS annual average hires rates (Table 18), separations rates (Table 20) and quits rates (Table 22), March 2026, and job openings (Table 1), September 2026 (government; includes restaurants)
- US Bureau of Labor Statistics, Occupational Employment and Wages, May 2025, Table 1, May 2026, and May 2019 release, March 2020 (government)
- US Bureau of Labor Statistics, OEWS frequently asked questions, page dated July 9, 2026, where BLS cautions about comparing OEWS estimates across years (government)
- US Bureau of Labor Statistics, Employment Cost Index, Table 9, second quarter 2026 release (government; includes restaurants)
- US Bureau of Labor Statistics, Productivity and costs by industry: selected service-providing industries, 2025, August 2026; series values read from FRED (government)
- US Citizenship and Immigration Services (USCIS), alert on reaching the first-half FY2026 H-2B cap, release date September 16, 2025, via AILA, Doc. 25091611 (government alert, reposted by the American Immigration Lawyers Association)
- US Citizenship and Immigration Services (USCIS), alert on reaching the cap for the first FY2026 returning worker allocation, release date February 13, 2026, via AILA, Doc. 26021705 (government alert, reposted by the American Immigration Lawyers Association)
- US Department of Homeland Security and US Department of Labor, Temporary final rule on FY2026 H-2B supplemental visas, 2026-02131, February 2026 (government)
- US Department of Labor, Office of Foreign Labor Certification, H-2B selected statistics, FY2025, data as of September 30, 2025, and foreign labor news, January and July 2026 (government)
- US State Department, Summer Work Travel program, undated (government)